
Proposed topics for Masters thesis
(Scroll to the bottom of the page to check out some examples of past Masters theses)
Improving Random Forests using Kriging‑Based Sample Weights
Random forests are widely used for spatial prediction because they handle nonlinear relationships and complex interactions, but they typically ignore spatial autocorrelation and treat all training samples as equally reliable. In contrast, kriging explicitly models spatial dependence and provides location‑specific interpolation weights and uncertainty estimates (kriging variance). Combining these two perspectives could improve predictive performance and uncertainty quantification, especially in settings where sampling is irregular, clustered, or subject to measurement noise.
The main objective of the project is to develop and test methods that use kriging outputs—particularly kriging weights and variances—to define location‑dependent weights for samples or predictions in random forest models. The student will explore several integration strategies. One strategy is to use kriging weights or kriging variance as sample weights during random forest training, so that samples in areas of high uncertainty or low support exert less influence on the learned model, while samples in well‑supported regions are emphasized. Another strategy is to build a hybrid model in which kriging and random forest each produce a prediction at a location, and these predictions are combined using weights derived from their respective uncertainties, for example via inverse‑variance weighting.
The project will start based on synthetic cases where the spatial distribution of the labels is controlled, before moving to real datasets based on satellite remote sensing. It will also include sensitivity analyses to understand how the proposed methods behave under different conditions, such as varying sampling density and spatial clustering, the presence of measurement noise or label uncertainty.
Classification spatio-temporelle des habitats dans la réserve de la Grande-Cariçaie
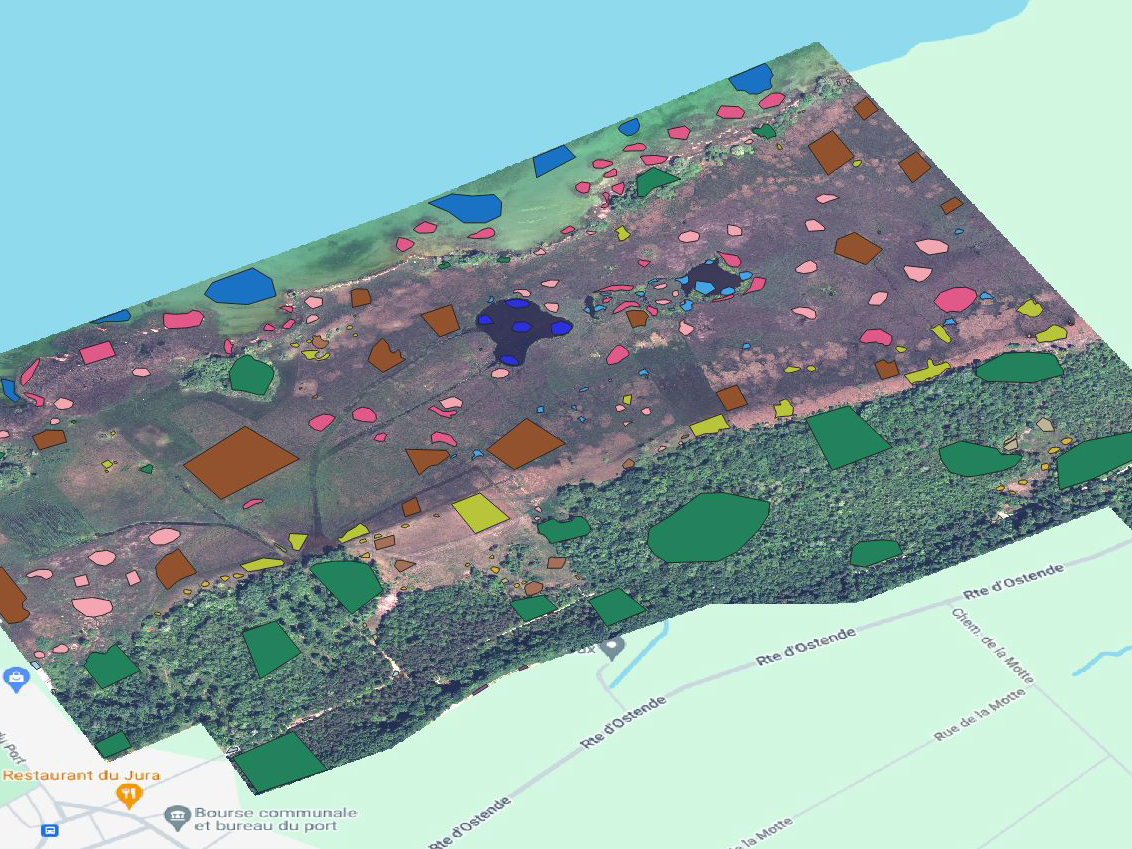
La réserve de la Grande Cariçaie (https://grande-caricaie.ch/fr/accueil/), sur les rives du lac de Neuchâtel, abrite une grande diversité d’habitats, et est un lieu d’étude idéal des changements environnementaux. Ce travail consistera à cartographier ces habitats à l’aide de différentes images satellites et aériennes, ainsi que de données de terrain acquises en collaboration avec l’association de la Grande Cariçaie.
Illustration de données d’entrainement utilisées lors de tests préliminaires.
Investigating foundation models for generating synthetic satellite images
There is a scientific interest in generating synthetic satellite images, for instance to complete image time series in case of sensor malfunction, or to generate old images for epochs when satellites were not yet available. Recently, foundation models such as Prithvi-EO-2.0 (https://research.ibm.com/blog/prithvi2-geospatial) have shown potential in solving many Earth Observation problems. This made it possible to solve a range of problems related to the use of satellite data. This project will consist in testing Prithvi-EO-2.0 for synthetic satellite image generation, using a number of test cases for which existing results are available for comparison.
Deep learning for streamflow-based snow mass reconstructions
Deep learning models have been applied to many different areas of hydrology over the last several years, with a lot of success. One area where they have not yet been applied is in the reconstruction of 20th century snow mass evolution. In the 21st century there have been many snow mass reconstructions using remote sensing and snow station observations, but in the 20th century there are many years in many catchments where we have streamflow observations and meteorological observations, but still no snow mass reconstructions. In this project, you will apply a deep learning model to learn the relationship between streamflow, meterological observations and 21st century snow mass reconstructions. The model takes streamflow and meteorological observations as input and produces snow mass as output. After training on 21st century data, we can apply the model on the 20th century and obtain the snow mass reconstructions that are currently still missing. Retrieving this historical snow information could tell us more about the impact of climate change on the amount of snow in our mountains and in our rivers.
Is the Swiss Plateau getting less foggy with climate change?
The occurrence of fog and low stratus over the Swiss Plateau has shown substantial interannual and decadal variability. Trends in fog occurrence and patterns may be present, but may be hard to detect. This topic will use large amounts of satellite data to derive fog frequency and extent indicators. The indicators will be first tested on the Swiss Plateau, then used on other fog-prone areas.
Reconstructing snow accumulation in 100+ catchments using precipitation and streamflow
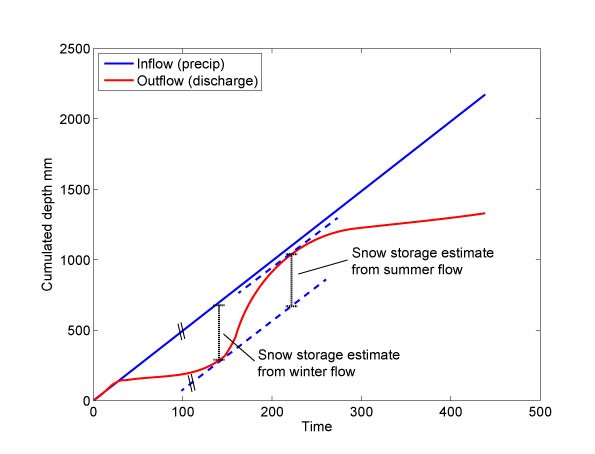
Throughout the winter in mountainous catchments, we measure precipitation without having discharge, whereas in spring we have discharge without measuring precipitation. The deficit between the accumulated precipitation and the accumulated discharge gives us an estimate of the total amount of snowfall over the course of one winter. This technique of measuring snow accumulation is called the mass-curve technique, and in this project you will apply it to 100+ catchments to discover variability and trends in snow accumulation over the last 50+ years.
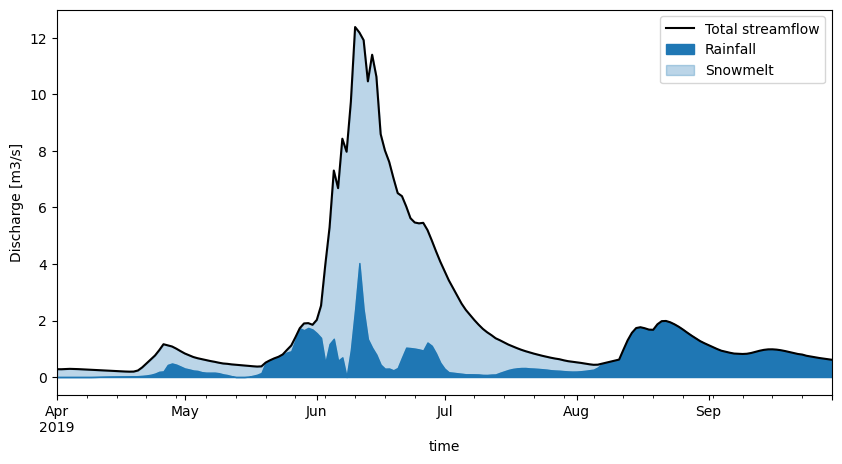
Machine learning-based hydrograph seperation
Streamflow time series of mountainous catchments are a mix of rainfall and snowfall output. It is difficult to unmix them, to estimate the partition between rainfall and snowfall just from looking at the discharge. In this project, you will give it a try with a machine learning algorithm. The alrogithm will be trained in an artificial setting, where we know both the inputs (mixed rainfall/snowfall discharge) and the outputs (unmixed rainfall+snowfall partitions). Once it works on the artifical setting, you can try it out on real discharge time series.
Comparing observed and simulated snow line altitudes
The snow line altitude is crucial for water resources, ecology, and winter tourism, but predicting it accurately is challenging. While remote sensing and webcam imagery provide reliable observations, meteorological forecasts and reanalysis products often struggle to estimate the zero-degree line, a key predictor of the snow line altitude. Local factors such as humidity, temperature stratification, and surface conditions further complicate the prediction of whether precipitation falls as snow or rain.
This project will compare snow line altitudes estimated by meteorological products with observations from webcams and remote sensing imagery. Given the limitations in resolution and temperature accuracy in mountainous terrain, identifying systematic biases in these products could help apply corrections, ultimately improving hydrological and ecological models in these regions.
Interpolation of speleothem-derived isoscapes for paleoclimate reconstruction
The isotopic composition of precipitation (mainly oxygen-18 and deuterium) provides valuable information on past temperatures, precipitation patterns, and atmospheric circulation. By analyzing isotopic records from various natural archives, we can reconstruct a picture of past climates, which is otherwise inaccessible. This can potentially inform our understanding of current and future climate change.
Speleothems (cave stalagmites) are a valuable record of precipitation isotopic composition. The SISAL database (https://pastglobalchanges.org/science/wg/sisal/intro) contains isotope data for hundreds of speleothems over the world, and spans thousands of years. This project will seek to interpolate this data in order to obtain worldwide isotope maps in the past (names isoscapes), using geostatistical (e.g. kriging with external drift) and/or machine learning approaches. These can be implemented using Google Earth Engine.
References:
Erdélyi, D., Kern, Z., Nyitrai, T. et al. Predicting the spatial distribution of stable isotopes in precipitation using a machine learning approach: a comparative assessment of random forest variants. Int J Geomath 14, 14 (2023). https://doi.org/10.1007/s13137-023-00224-x
Dániel Erdélyi, István Gábor Hatvani, Hyeongseon Jeon, Matthew Jones, Jonathan Tyler, Zoltán Kern, Predicting spatial distribution of stable isotopes in precipitation by classical geostatistical- and machine learning methods, Journal of Hydrology, Volume 617, Part C, 2023, 129129, ISSN 0022-1694, https://doi.org/10.1016/j.jhydrol.2023.129129.
Cartographie de la granulométrie des éboulis en haute montagne
Dans les régions de haute altitude, de grandes zones sont couvertes d’éboulis. La taille des grains qui composent ces éboulis est un facteur important contrôlant l’occurrence de permafrost et aussi l’apparence de végétation. Une méthode a été mise au point pour cartographier et identifier les grains à partir d’images prises par drones . Ce projet consiste à appliquer cette méthodologie sur une zone étendue des Alpes Vaudoises.
Analyse de séries de débits dans le Val d’Heremence
Ce sujet consistera à analyser de longues séries temporelles de début dans la région du barrage de la Grande Dixence. A partir de données historiques de débit, il est possible de déduire la durée et l’intensité des périodes de fonte de neige, et partant d’estimer les conditions d’enneigement à des époques lointaines dans le passé (i.e. lorsque les données satellite n’étaient pas encore disponibles).
Reconstruction de données d’évaporation synthétiques pour le Bassin de la volta
Dans la région du bassin de la Volta (Afrique de l’Ouest), des millions de personnes dépendent de ressources en eau dont le régime est peu informé en données. Ce sujet consistera à mettre en oeivre des méthodes statistiques développées dans notre groupe pour générer des données d’évapotranspiration synthétiques mais plausibles, pour des périodes où les données satellite de sont pas disponibles (p.ex. dans le passé). Le but final est de pouvoir reconstruire l’état du bassin-versant sur une longue période à l’aide de modèles qui ont besoin de ce genre de données.
Downscaling of Digital Elevation Models with landscape evolution models
High-resolution Digital Elevation Models (DEMs) are often not available for studies of the earth surface. This project aims at testing an approach for downscaling DEMs using the laws governing erosion of a landscape (https://www.sciencedirect.com/science/article/pii/S0169555X12004618).
Etude de la relation entre pluviométrie et altitude à plusieurs échelles
La pluie est typiquement considérée comme corrélée à l’altitude, et cette relation est utilisée de façon générale pour interpoler des données ou pour formuler des modèles. Cependant, des données très locales semblent indiquer que cette relation n’est pas toujours valide lorsqu’on se focalise sur l’échelle de petits bassins-versants et sur des moyennes mensuelles ou saisonnières plutôt que annuelles. Il est possible que dans ces cas, d’autres facteurs peuvent être prépondérants pour expliquer l’intensité des pluies. Ce projet vise à établir de telles relations (ou absence de relations) en analysant des données de stations météorologiques dans les alpes.
Satellite image downscaling with block-Direct Sampling
A few years ago, a geostatistical simulation was developed to generate a stochastic image while respecting constraints imposed on a larger scale. This can potentially be used for downscaling. This topic will test the applicability of this idea. Here is the reference to the geostatistical simulation approach, for which a fully-functional code code is already available:
Straubhaar J, Renard P, Mariethoz G (2016). Conditioning multiple-point statistics simulations to block data. Spatial Statistics 16, 53-71, doi: 10.1016/j.spasta.2016.02.005.![]()
Quantify extreme temperature values on the earth surface using Landsat-8 TIRS
Landsat-8 has the highest-resolution long-term thermal sensor. It can allow to spot very local temperature extremes that are undetectable with lower resolution sensors. This project is to detect such extreme surface temperatures and possibly explain them.
Colorization and downscaling of drone imagery
Images acquired by drones often do not have many spectral bands (typically RGB). Multispectral camera can be mounted on drones, but then offer a lower resolution. This topic will apply a pansharpening method to add bands to drone images acquired with a high-resolution RGB camera, based on a lower resolution multispectral acquisition.
It will be based on an approach to statistically reconstruct the missing bands in images, described in this paper:
Gravey M, Rasera L, Mariethoz G (2019). Analogue-based colorization of remote sensing images using textural information, ISPRS Journal of Photogrammetry and Remote Sensing, 147: 242-254, doi: 10.1016/j.isprsjprs.2018.11.003.
Quantifying patterns of change in snow cover
Snow cover in alpine regions is complex. It is driven by many factors, such as altitude, slope, solar exposition, vegetation, among others. Daily satellite images allow observing the snowy areas and their evolution in great details. This project will use such data and morphological operators (https://en.wikipedia.org/wiki/Mathematical_morphology) to determine the processes through which snow appears and disappears throughout a season. Such methods allow defining the countours of the snow areas or their “patchiness”.
Merging radar and gauge measurements using multiple-point geostatistics
There are two main sources of data for operational measurement of rainfall: weather radars and rain gauges. While radar data are very useful to obtain spatial maps and to measure rain in inaccessible areas, it generally produces data that have a relatively low spatial resolution and that present numerous biases. Rain gauges data are generally much more accurate, but only available as point measurements, which need to be interpolated, thus resulting in significant uncertainty. Several methods exist to merge these two sources of data, however they often involve assumptions that result in a misrepresentation of rainfall heterogeneity. Moreover, the final product often does not match what is measured in the rain gauges (e.g. the radar indicates rain where rain gauges measured no rain).
This project will investigate the use of multiple-point geostatistics methods, to generate rain fields that are consistent with the heterogeneity of the radar data, and that are in agreement with the rain gauges. It will involve using existing software and available MeteoSuisse data products.
Comparison of methods for clouds removal on satellite images
Increasingly, high-frequency images of virtually every place on earth are available to the scientific community. However, the presence of clouds on satellite images is one of the main obstacles that prevent us from having data available everywhere and all the time. Many methods have been proposed to reconstruct the missing parts of the images.
This work will focus on the rather common situation, where we have a set of images for a certain region, acquired on different dates. Some images are affected by the clouds, others are not, and we can reconstruct the surface information by cross-checking the information of both images. The goal will be, from satellite data acquired in different environments, to test different methods proposed in the literature and to conduct a quantitative comparison.
Simulating time series with extreme values using multiple-point geostatistics
In recent years, resampling-based approaches have emerged as a useful way of generating stochastic time series. They allow predicting the characteristics of future rainfall or streamflow considering a range of complex behaviors, which is difficult to accomplish with other approaches. Moreover, resampling-based methods are easy to understand and to implement, and therefore attractive from an application point of view. However, one limitation of those approaches is the simulation of extreme values. Indeed, when resampling training data, it is not possible to generate higher values than those already available in the training data.
This project will explore one possible workaround to generate extreme values in the context of resampling approaches, using the framework of multiple-point geostatistics. Time series generation usually involves using as input a training dataset that has a given temporal resolution (e.g. hourly) and simulate at the same resolution. The idea explored here is to first downscale the training data (e.g. a half-hourly resolution), and use this downscaled data for training. The resulting simulation (half-hourly) is then upscaled again (to an hourly resolution). This procedure can generate values outside the range of the training data, and can be repeated iteratively to enhance the extreme values. The downscaling approach used should also play a role in the magnitude of the extremes.
This project will test the approach using existing resampling-based codes that are developed in the GAIA group.
Investigating the influence of shadows on reflectance spectra
When using remote sensing in mountain areas, shadows can pose significant problems. For a given surface type, the reflectance spectrum can be very different depending on the shadow/sunlit condition. In shadow areas, most of the incident light comes from reflection on surrounding slopes, as well as from skylight (atmospheric effects). As a result, classification of corresponding images can be challenging and often one has to define separate classes for shadown and sunlit areas.
This project will investigate ways to relate the reflectance spectra of shadowy and sunlit areas, for a given surface type. Snow surfaces are of particular interest because the high reflectance implies that surrounding slopes will have a strong influence on shadow areas. The work will involve a comprehensive literature review, followed by a systematic comparison of spectra acquired in mountain regions, for images coming from different satellite platforms, including Sentinel-2, Landsat and MODIS.
Some past masters theses
Candice Dubath (2023) – PDF
Jason Bula (2019) – PDF
Dionys Lugon-Moulin (2019) – PDF
Myriam Eggerschwiler (2018) – PDF
Rachel Bungener (2018) – PDF
Danick Perrin (2018) – PDF
Raphael Vallat (2018) – PDF
Romain Udry (2017) – PDF