|
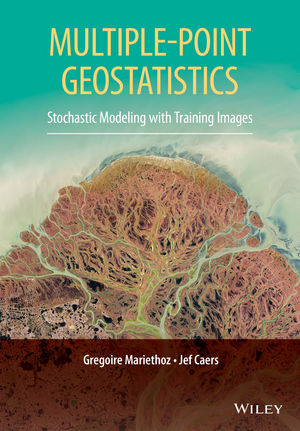
On these pages you will find additional resources under the form of a library of training images, links to research codes and updated bibliographic references. These training images are the source files of the examples that we have used in the book, and are available to download and use for testing methods and for benchmarking computer codes. The book provides a comprehensive introduction to multiple-point geostatistics, where spatial continuity is described using training images. Multiple-point geostatistics aims at bridging the gap between physical modelling/realism and spatio-temporal stochastic modelling. The book provides an overview of this new field in three parts. Part I presents a conceptual comparison between traditional random function theory and stochastic modelling based on training images, where random function theory is not always used. Part II covers in detail various algorithms and methodologies starting from basic building blocks in statistical science and computer science. Concepts such as non-stationary and multi-variate modeling, consistency between data and model, the construction of training images and inverse modelling are treated. Part III covers three example application areas, namely, reservoir modelling, mineral resources modelling and climate model downscaling. This book will be an invaluable reference for students, researchers and practitioners of all areas of the Earth Sciences where forecasting based on spatio-temporal data is performed. Book contentsPart I
Part II
Part III
Training images used in the bookBelow are some of the training images that are employed in the book. They are presented both graphically and in ASCII format. A more extensive training image library can be found on our Github repository.
These images be used freely for research purposes. All files are in GSLIB ASCII format. More details here: https://www.gslib.com/gslib_help/format.html.
Large files are split into several smaller zipped files. To extract them, download all parts to the same folder and then open the .zip file. Enjoy! Part IWalker Lake exhaustive DEM

100 sample data extracted from the Walker Lake DEM

Rock density in a homogeneous layer of a carbonate reservoir (3D)

Rock density in a heterogeneous deltaic reservoir (3D)

Walker lake exhaustive DEM categorized

Walker lake 100 sample categorized DEM data

Training image, categorized
Part II1D-temporal grid representing 120 years of daily rainfall measures in Sydney, Australia

2D grid of a satellite image of the Sundarbans region, Bengladesh

3D grid representing the hydrofacies in an alluvial aquifer in the Maules Creek valley, Australia.

Red component, green component and blue component of an image.

Channels training image (Strebelle 2002)

Ganges delta, Bangladesh

2D grid of a satellite image of the Sundarbans region, Bengladesh – transformed in a binary variable.

Two simple training images

Lines with arrows

Elementary training image: categorical 3D layers

Elementary training image: continuous 3D layers

3D categorical folds

3D continuous folds

Multivariate training image
Link to file in ASCII format 
Herten training image (Bayer et al. 2011)

FLUVSIM object-based model

Elementary training image – 3D checker

Rotation-invariant simulation – 90 degrees tolerance
Rotation-invariant simulation – 20 degrees tolerance

Reconstruction of sea surface temperature over the Pacific Ocean
Incomplete data and 5 realizations Link to file in ASCII format 
Process-based model (FLUMY)
Link to file in ASCII format (part 1) 
Stone wall training image
Part IIIWest Coast of Africa object-based training images
Additional resourcesBibliographic resources |


