Categories
Geography MAPS Mobility Networks Social network Social science World

River maps: coloring the world’s circulatory system

Rivers are fundamentals in creating the right conditions for life: that is why most cities since ancient civilizations were built along their banks. Rivers form intricate networks linking the main branches and their smaller tributaries. These river webs have been mapped by geographer Szűcs Róbert, dividing our planet’s watersheds into colorful catchment areas, and providing an informative look at how water flows across continents.

Check out the full article on visual capitalist, and take a look at Robert’s wonderful maps!

Watershed Map of the United States & Cascadia – by Szűcs Róbert


Categories
Cities Environment MAPS

The Million Neighborhoods initiative: mapping spatial inequalities within cities.

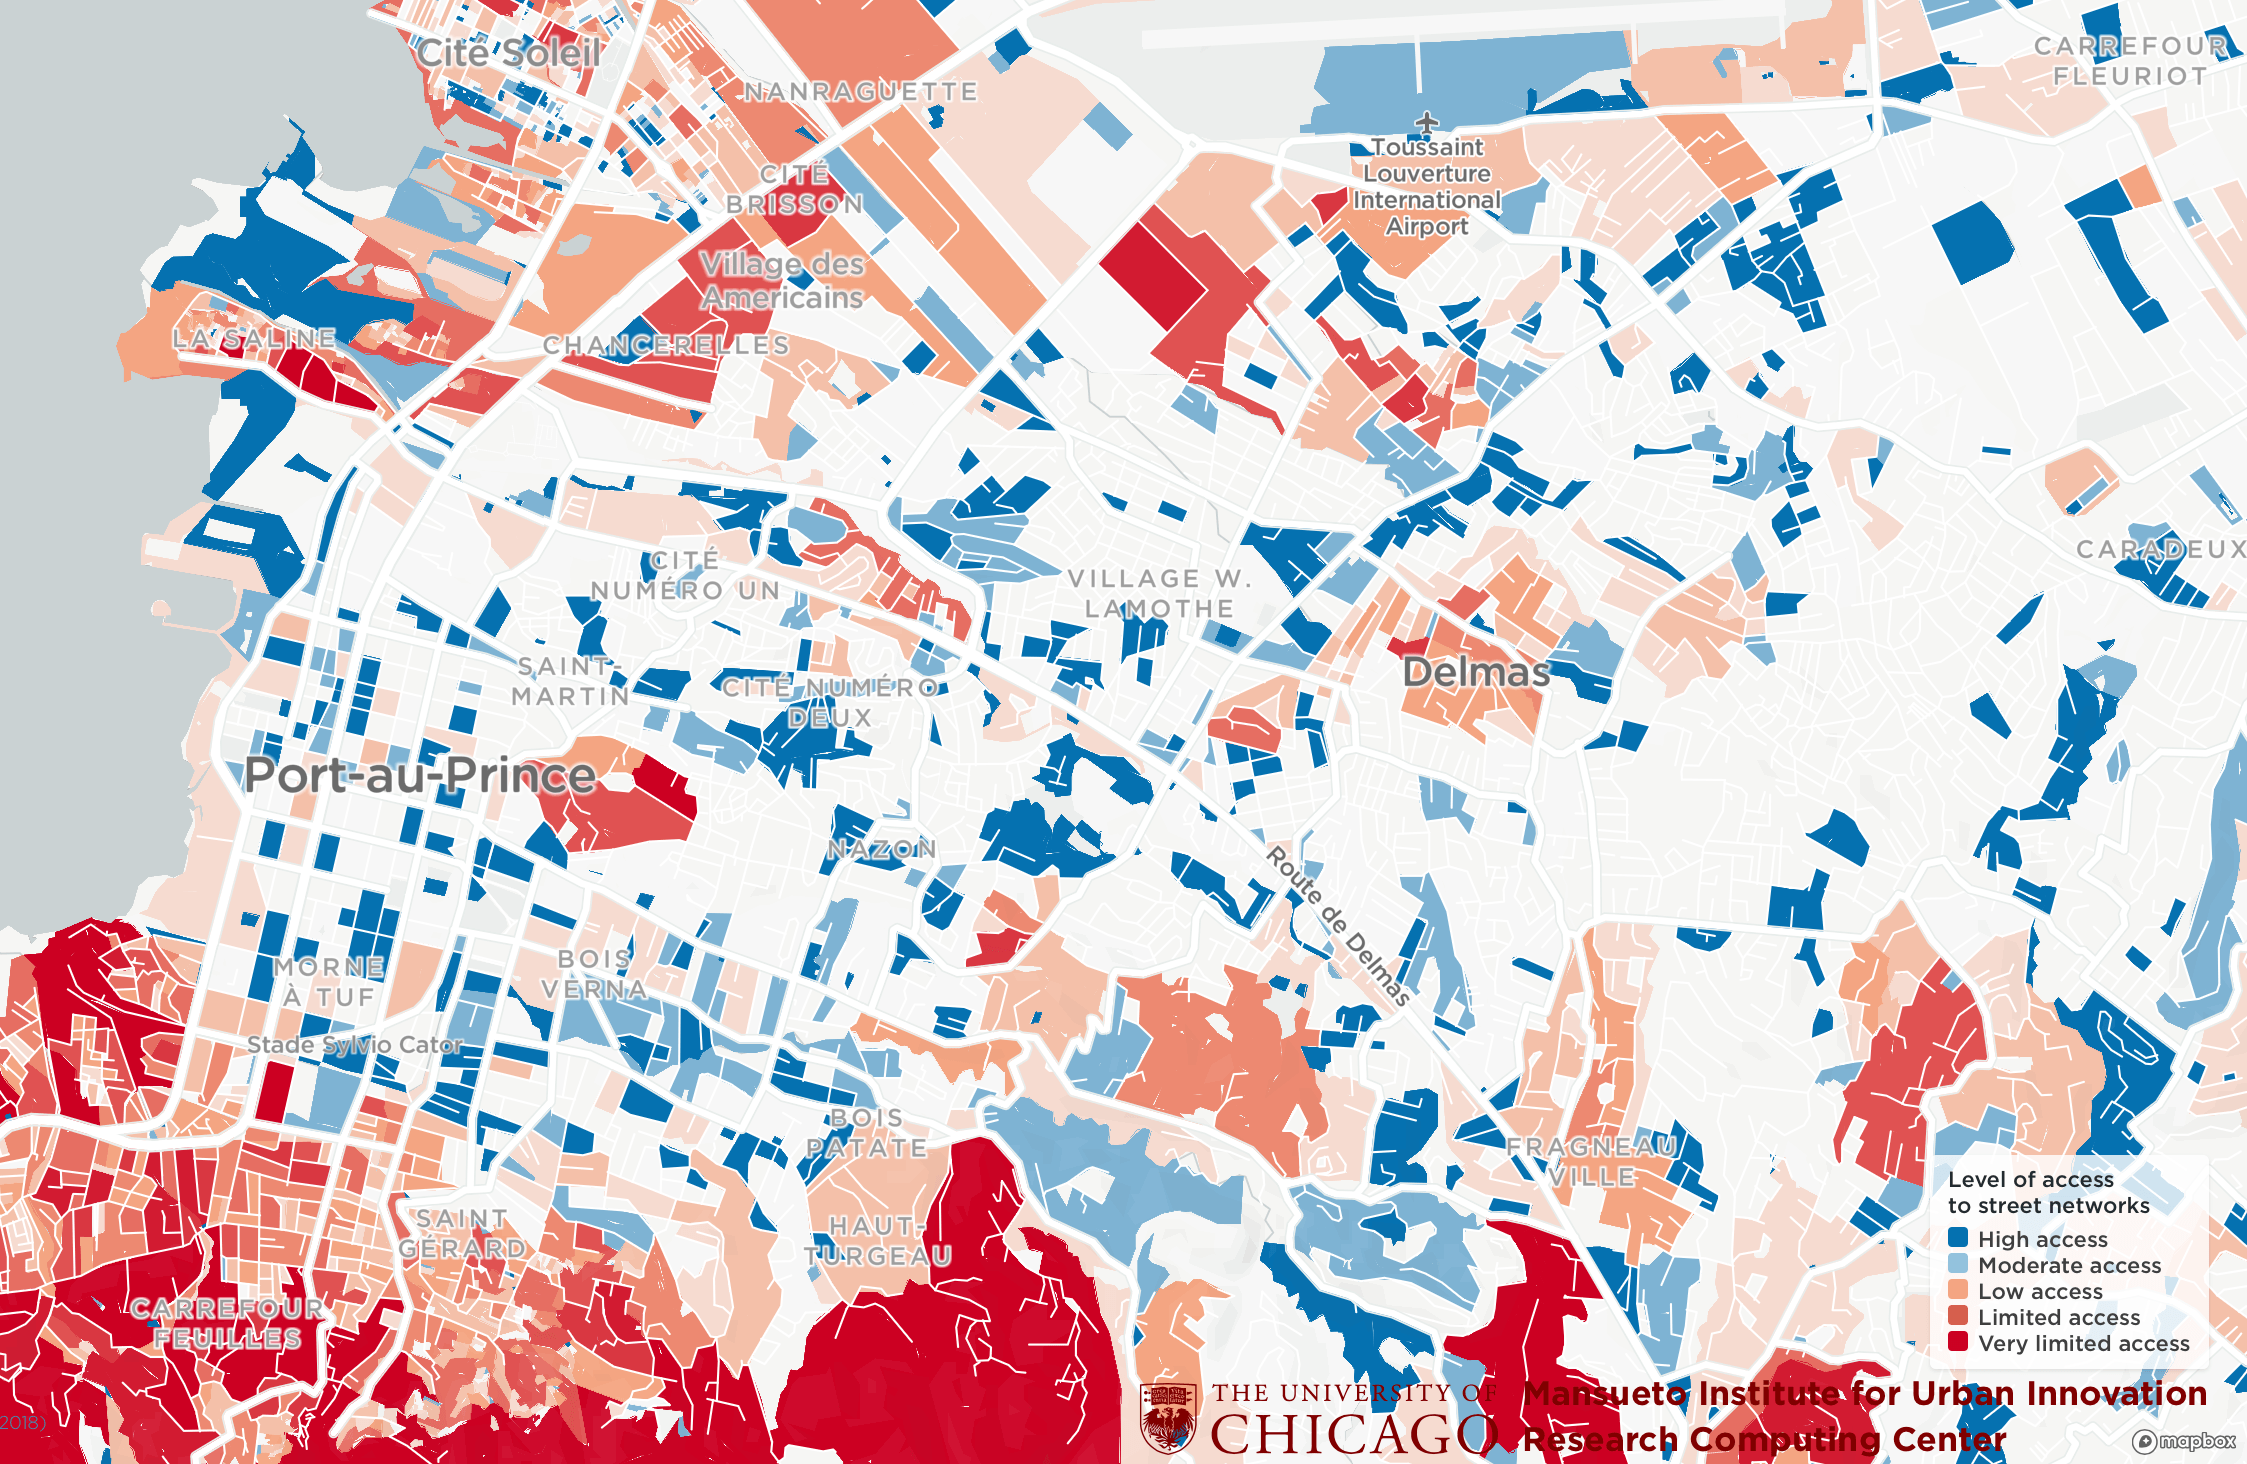
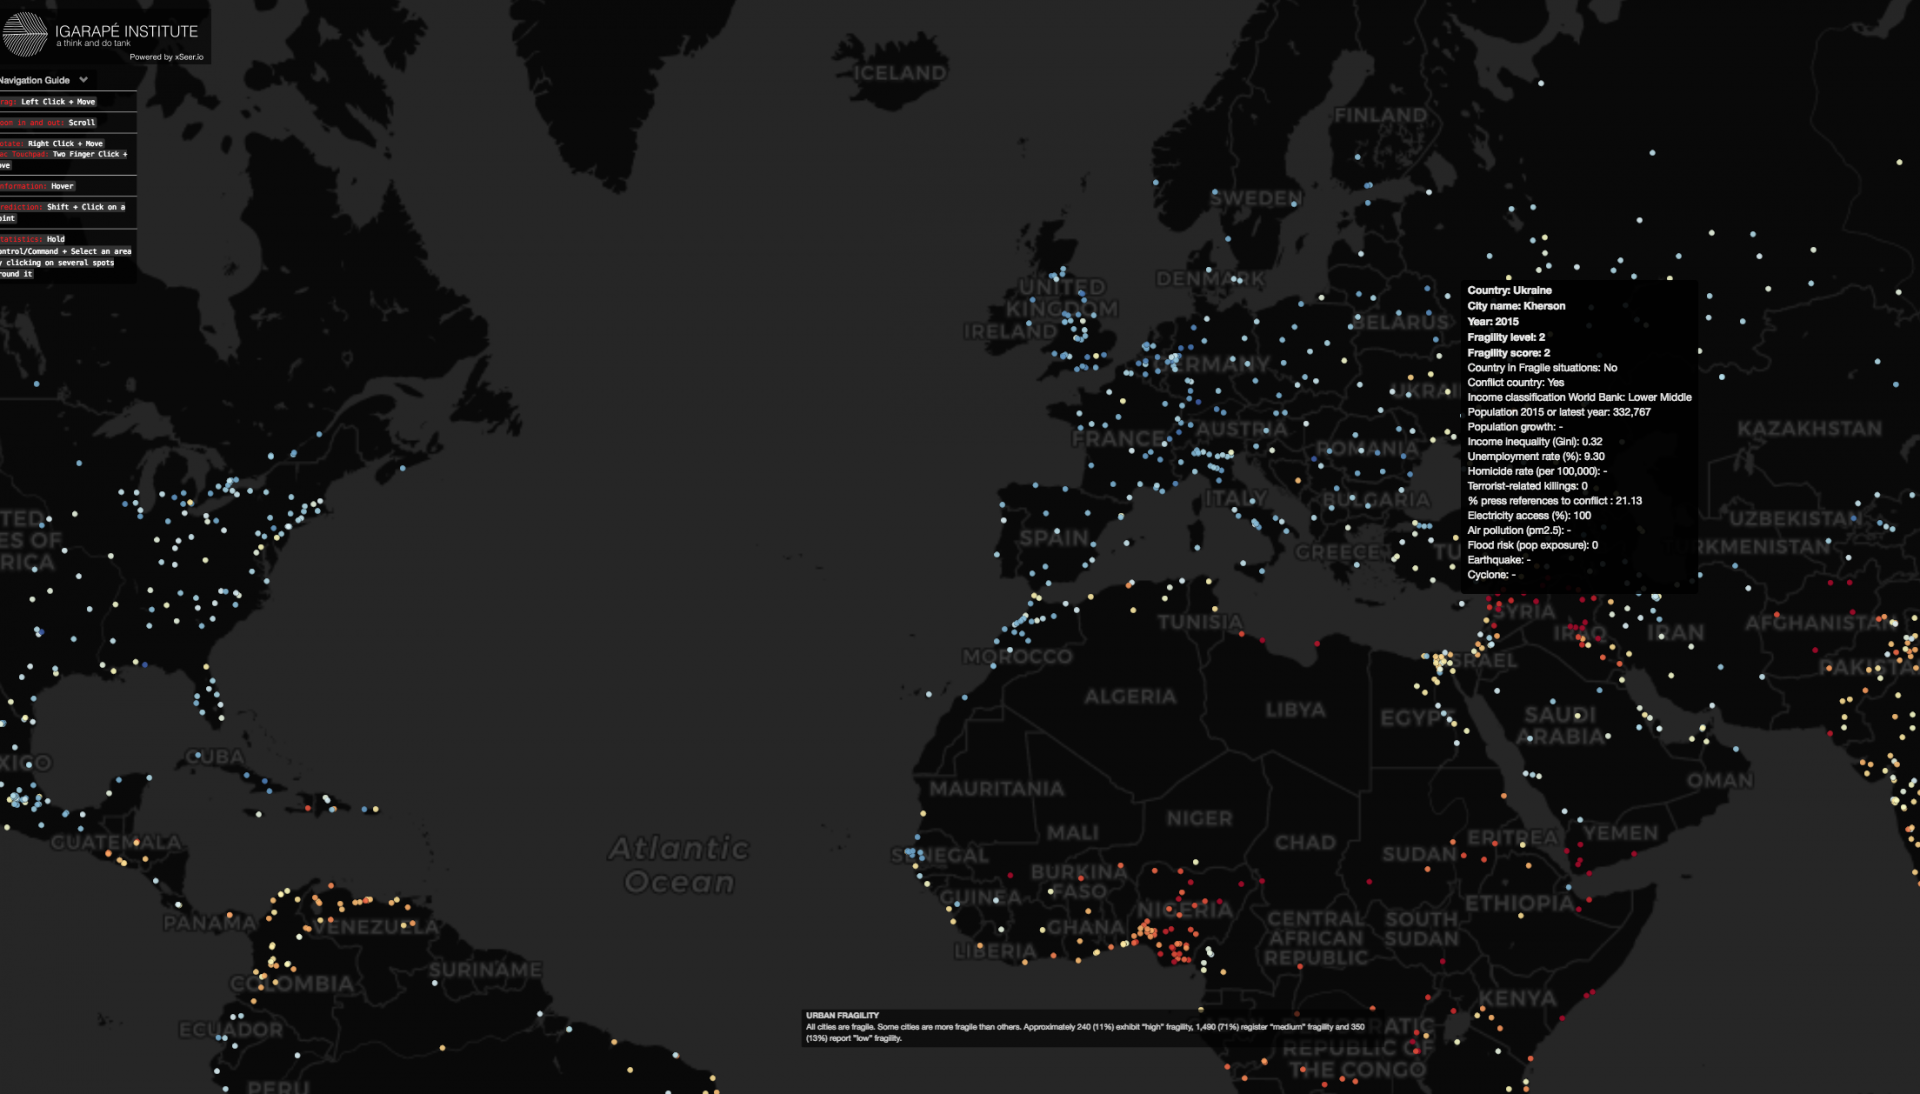
The Million Neighborhoods Map is a groundbreaking visual tool that provides the first comprehensive look at informal settlements across Africa, helping to identify communities most in need of roads, power, water, sanitation and other infrastructure. Updates for Central and South America, India and parts of Europe and Asia will come online in early 2020.

The Million Neighborhoods Map is the first such map of its kind and digitally renders building infrastructure and street networks – or the lack thereof. The goal is to provide municipal leaders and community residents with a tool to help inform and prioritize infrastructure projects in underserviced neighborhoods, including informal urban settlements that are sometimes known as “slums.”

View the map at https://millionneighborhoods.org.

The Million Neighborhoods initiative is a collaborative network of diverse organizations working locally in Chicago and in neighborhoods throughout the world towards more sustainable and equitable human development. The network builds a common framework, tools, and data for mapping, planning, and coordinating solutions towards fulfilling the UN’s Agenda 2030 for Global Sustainable Development.

For the science behind the map, check out:

Brelsford, C., Martin, T., Hand, J., Bettencourt, Luís M. A., Toward cities without slums: Topology and the spatial evolution of neighborhoods (August 29, 2018). Science Advances. Vol. 4, no. 8, eaar4644. https://doi.org/10.1126/sciadv.aar4644

Brelsford, C., Martin, T. Bettencourt, Luís M. A., Optimal reblocking as a practical tool for neighborhood development (June 12, 2017) Sage Journals. https://doi.org/10.1177/2399808317712715


Categories
Geography Mobility Networks SCIENCE Simulation Social network

Google mobility reports: big data to help fight Covid pandemic

Last week Google has published the “COVID-19 Community Mobility report”. In the context of strict confinement measures, and while some governments (China above all but also Italy, France and Spain) have resorted to mobile phone data to assess whether citizens are respecting the lockdown, Google has published anonymized mobility data from a number of countries showing the effect of limitations on individual movements.

The reports use aggregated, anonymized data to chart movement trends over time by geography, across different high-level categories of places such as retail and recreation, groceries and pharmacies, parks, transit stations, workplaces, and residential. We’ll show trends over several weeks, with the most recent information representing 48-to-72 hours prior. While Google displays a percentage point increase or decrease in visits, they do not share the absolute number of visits. To protect people’s privacy, no personally identifiable information, like an individual’s location, contacts or movement, is made available at any point.

In Switzerland, for example, data are available on a national and canton basis, and they show a clear decrease in mobility patterns since the beginning of the lockdown on March 16.

What about your country or local area?

You can access all reports at https://www.google.com/covid19/mobility/


Categories
Graph analysis Networks SCIENCE Simulation

The cosmic web and a slime mold: network patterns across scales

Is there a relation between a yellow slime organism called Physarum polycephalum, that  can be easily found on decaying trees and leaves in the forest’s shade, and the complex organization of galaxies?

Researchers Joe Burchett and Oskar Elek at the University of California at Santa Cruz created a 3D algorithm that represents how the slime builds its networked structures in space. Then, they applied the algorithm to a dataset of 37.000 galaxies, finding a rather precise representation of the cosmic web. In the words of one of the authors:

“That was kind of a Eureka moment, and I became convinced that the slime mold model was the way forward for us,” Burchett said. “It’s somewhat coincidental that it works, but not entirely. A slime mold creates an optimized transport network, finding the most efficient pathways to connect food sources. In the cosmic web, the growth of structure produces networks that are also, in a sense, optimal. The underlying processes are different, but they produce mathematical structures that are analogous.”

This is an interesting step towards understanding the laws of complexity and how they create similar structures across scales. Read the full contribution here.

Categories
Art Graph analysis Networks Vizualization

“L’art trouble, la science rassure” – Bringing art and network analysis together

Kirell Benzi is a data artist, speaker and data visualization lecturer. He holds a Ph.D. in Data Science since 2016, which he obtained at EFPL (Ecole Polytechnique Fédérale de Lausanne).

Building on very heterogeneous datasets (collaborations between musicians, patents, corporate links and much more) Kirell created a number of artistic network visualizations in which the insights from data are powerfully supported by the strength of the representation.

Please visit his outstanding network art gallery at: https://www.kirellbenzi.com

The featured image shows the network of Montreux Jazz musicians:

“This network shows with whom musicians of the festival play with, revealing two different categories of artists. At the border of the ring, we have the artists who only perform with their band, forming many disconnected communities. On the opposite, those who jam with everyone, the stars of the festival, are well-connected and are naturally located in the center of the ring. One of the brightest stars was George Duke, the champion of appearances at the festival with 53 concerts. In the center in orange, he faces the legendary guitarist Santana in purple.”


Categories
Geography Simulation Social network Vizualization

An agent-based simulation of coronavirus diffusion

As the coronavirus pandemic continues to spread across the world, governments are taking measures to slow down the spread of the contagion among the population. In fact, while there is no way the virus can be stopped altogether, it is crucial to slow down its diffusion in order no to overload hospitals and intensive care units.

Journalists of the Washington post have created an agent based simulation  in order to explain the importance of social containment measures in which agents, represented as moving dots, move into space getting infected, transmitting the disease and recovering. The four different simulation scenarios  — a free-for-all, an attempted quarantine, moderate social distancing and extensive social distancing — show that when restrictions to the movement are implemented the contagion curve clearly flattens out, while if the agents are left unrestrained the curve of infected people grows exponentially.

This timely piece of data journalism shows the importance of social distancing during this unprecedented global pandemic and interest and the potential of agent-based models to illustrate social dynamics in space.


Categories
Art Cities SCIENCE Society

When Holling meets Kandinsky: Panarchy, Resilience and Abstraction

“Identifying and managing risks is nowadays key in any strategic planning. Under the wording risk management, companies aim to control and minimize the risk level that could impact their short or long-term profitability. In cities, risk management is expected to drive urban planning safety approach and better integrate hazards occurrence. It is based on procedural and systemic approaches, most of the time certified, built on conventional and analytical methodologies.

In a rapidly changing world where surprise is likely (1), the same descriptive approach applies on our environment threatened by natural hazards. Our fragility awareness reflects in greater consideration for human vulnerability, but the modus operandi to decrease the risk level is comparable, based on decision tree analysis and quantitative/qualitative frameworks. Amongst the first questionings on the relevance of such linear thinking, Holling’s “panarchy” (2) conceptual model introduced the idea that social and ecological systems are interlinked and continuously restructure and renew depending on their environment. By reconsidering the norms, introducing unpredictability as a random variable and conceptualizing risk management, the seeds of resilience had been sowed. On one hand, a normative approach; on the other, a critical thinking?”

Full post and a rich bibliography here.


Categories
Economy Environment Europe Geography MAPS

How will climate change impact European regions?

The European Environmental Agency has recently published a cartographic platform to map the impact of global warming on droughts, floods, agriculture, forest fires and sea level rise in Europe. These maps are based on different greenhouse gas emissions scenarios (medium or high) and refer to the expected changes in the period 2041-2070 as compared with the period 1981-2010. Data and climate models and have been published already in various EEA reports and indicators. Based on these maps, what are the challenges that your region faces and how to adapt to them?

Categories
Cities Environment Geography MAPS Vizualization

The Atlas of urban expansion- how do cities grow?

The Atlas of Urban Expansion collects and analyzes data on the quantity and quality of urban expansion in a stratified global sample of 200 cities. With the aid of satellite images researchers have gathered a rich dataset on built-up areas and the associated land use regulations and policies that sheds light on the process of expansion of urban peripheries since 1990. Besides, for a sample of 30 cities, researchers gathered historical data on urban expansion from 1800 to 2014 and used it to generate visually appealing animations that show intuitively the process of urban growth. See, for example, the animation of Los Angeles below.

The Atlas of Urban expansion is a joint initiative by NYU Urban Expansion Program, the Stern school of Business at NYU in partnership with UN-Habitat and the Lincoln Institute of Land Policy.

The Atlas can be freely downloaded, and a number of urban data, maps and metrics can be also downloaded.


Categories
Environment Geography History Networks

Termites and the megalopolis

A recently published study in Current Biology has shown that a species of termites has been colonising a huge area of Brazil – its surface is equivalent to that of Great Britain- in the past 4000 years. The visible results of this work consist in a large number of earth mounds that can be up to 3 meters tall and 9 meters in diameter which are not nests but rather represent the accumulation of waste material from the insects’ construction of the underground network. The mainreason for this impressive effort is, according to the researchers, to stock and safely consume leaves that fall only during a short seasonal interval. This case show the impressive capability of certain species to collectively transform and adapt their environments by creating permanent structures that can persist for thousands of years. Ants or bees have often been associated to humans for their complex social organisation, division of labour and structure. Therefore, can we obtain some interesting insights and inspiration from these impressive spatial constructions that are even older than the pyramids?

Categories
Networks SCIENCE Social network

20 years of network science

This month of June marks the 20th anniversary of the seminal paper by Watts and Strogatz:

“Collective dynamics of small world networks”

In this article on Nature, author Alessandro Vespignani elaborates on the importance of this contribution in opening up the multidisciplinary field of what is today known as “network science”.


Categories
Cities Geography Networks Simulation World

Can cities’ network position explain the probability of violent conflict?

When we consider the global network of cities, is instability an inherent property of certain network positions?

Dr. Weisi Guo from Cardiff University believes this is the case. He recently co-authored a study in which he found that cities with a high network betweenness – that are centrally located in a path that connects different cities in the network-  are more likely to display high levels of violence, including war, terrorism and gang violence. On the other hand, cities with a high degree  or having connections to many other cities – were found to display a low level of violence.

How to interpret these results? the authors develop an agent based model that suggests that cities with fuzzy cultural boundaries, that serve as connections between culturally homogeneous areas, are indeed those with a higher level of betweenness. On the contrary, cities that are more culturally homogeneous turned out to show also a higher degree.

Even if the authors warn against the attempt to establish causality, which cannot be assessed by the study, their methods accurately identify some of the world’s current foci of conflicts such as Damascus, Aleppo and Baghdad but also Veracruz and Tegucigalpa, in central America. Also, the authors identify a number of cities that do not show at present a high level of violence but which might in the future such as La Mecca and Jeddah in Saudi Arabia, Teheran or Kunming in China.

Their study has been extensively covered by BBC   here

Also, you can access the full study, titled “The Spatial Ecology of War and Peace”  here. 

If you want to know more about the authors, they are:


Categories
Cities Geography MAPS Vizualization

Measuring cities’ fragility: an interactive mapping tool.

Launched in 2016 World Economic Forum in Davos from Igarapé Institute in collaboration with the World Economic Forum, the United Nations University, 100 Resilient Cities, XSeer and Canada’s Global Affairs, fragile cities  is an interactive tool that allows to visualize cities in terms of their fragility. The platform includes information on over 2,100 cities with populations of 250,000 or more. Cities were graded across 11 variables at the urban scale including population growth, inequality, unemployment, access to electricity, pollutions, exposure to terrorism, homicide rates and reported conflict events.and given a score between 1 (low fragility) and 4 (high fragility).

Besides, the evolution of urban fragility parameters in the period 2000-2015, and projections for the future, can be reconstructed by clicking on the dots.Below you can see, for example, the evolution of the fragility index for Lausanne:

Albeit cities’ fragility can be argued to be a much more multidimensional and complex concept, fragile cities is an interesting exploratory tool which could be useful to address issues of urban resilience.

Further information can be accessed here.


Categories
Cities Geography MAPS Vizualization

Transitflow: visualizing public transport routes in space and time

Columbia University student Will Geary created an instrument to visualize public transport flows through the 24 hours of the day.

For example, below you can see an example of visualization for the San Francisco Bay Area, in which small colored dots represent each a different mean of public transport (bus, subway, train, ferry..)

Want to know more?

Here you can get detailed information on how these maps where made and get the tools to create your own visualization for the city you’re interested in.