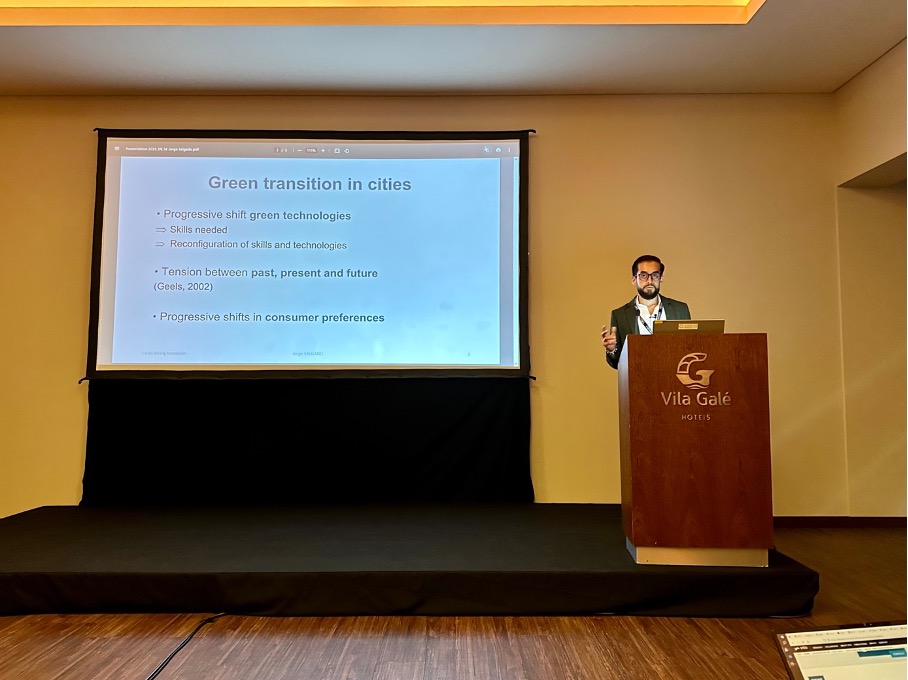
At the European Colloquium of Theoretical and Quantitative Geography 2023 (ECTQG, 2023), Jorge Salgado – researcher at Citadyne – presented the progress of his research entitled: “Cities in the face of green technologies, skills and preferences transitions: a multilevel complex approach”. His agent-based modelling approach allows the simulation of changes in firms technologies and consumer preferences as a result of the green transition. The research has been well received because it simultaneously integrates key elements of the economic system, enabling bottom-up interactions to understand the reconfiguration of urban systems around the world.
If you are interested in this research you can contact Jorge Salgado:
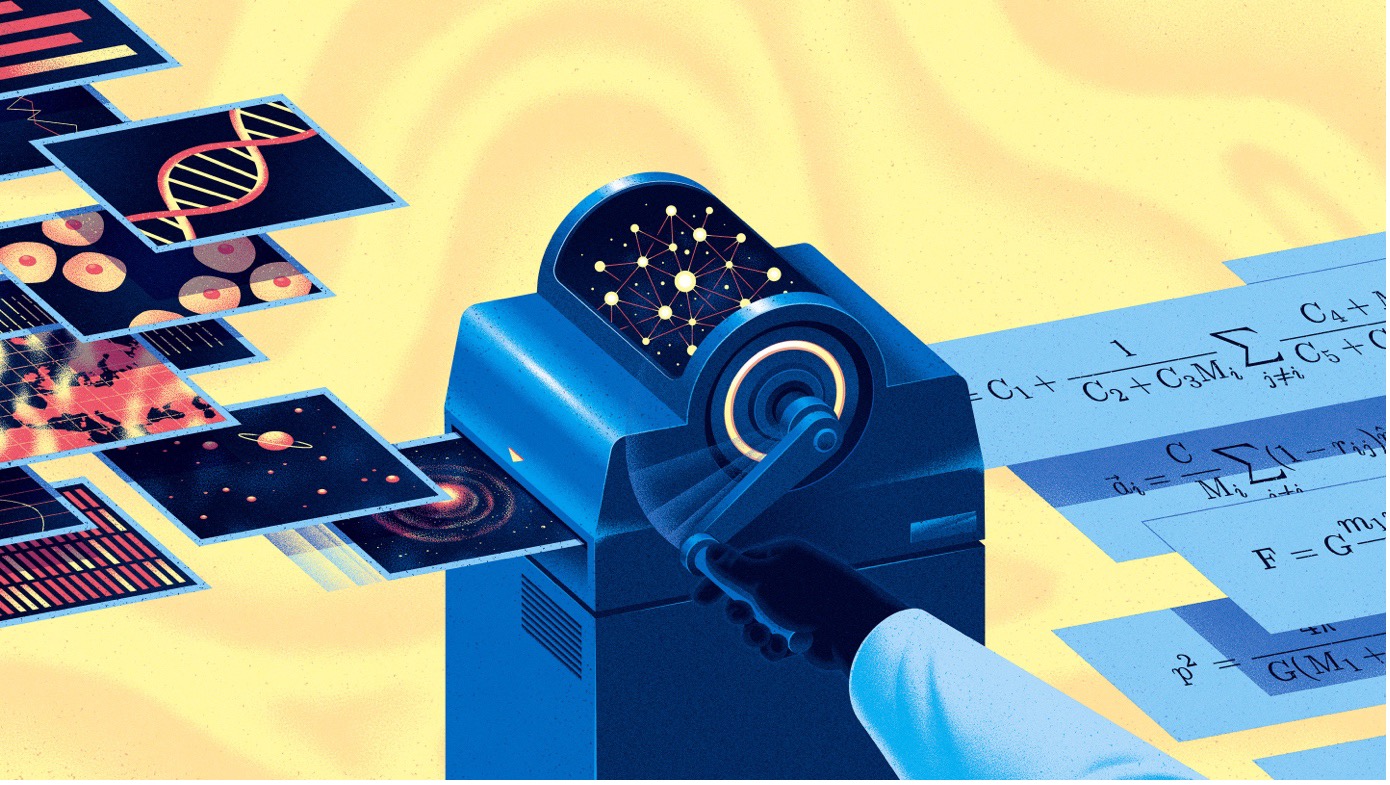
Charlie Wood of Quantamagazine published in 2022 an article that highlighted the 2017 research work of Roger Guimerà and Marta Sales-Pardo, who discovered a cause of cell division – the process that drives the growth of life – using an unpublished and novel tool, a digital assistant they called a “machine scientist”. The method quickly gained acceptance, and Sales-Pardo & Guimerà are among a handful of researchers developing the latest generation of tools, known as symbolic regression. A description of the key elements of the tool can be found in Guimera et al. (2020).
In general, symbolic regression is a type of machine learning that can identify mathematical relationships between variables in data sets using Bayesian probability theory. It has been used to discover new equations that describe physical phenomena, such as the movement of fluids or the behavior of materials under stress. Researchers supporting the expansion of these methods say we’re on the cusp of “GoPro physics”, where a camera can point at an event and an algorithm can identify the underlying physical equation.
According to Wood’s article, machine scientists are being used in fields such as biology, chemistry and materials science to make new discoveries and accelerate scientific progress. For example, a team led by scientists at London-based artificial intelligence company DeepMind has developed a machine learning model that suggests the properties of a molecule by predicting the distribution of electrons within it.
If you are interested in the state of the art related to these approaches Liu et al. (2023) recently published the article “Data, measurement and empirical methods in the science of science”, which includes the Guimerà and Sales-Pardo experience. The publication is available in:
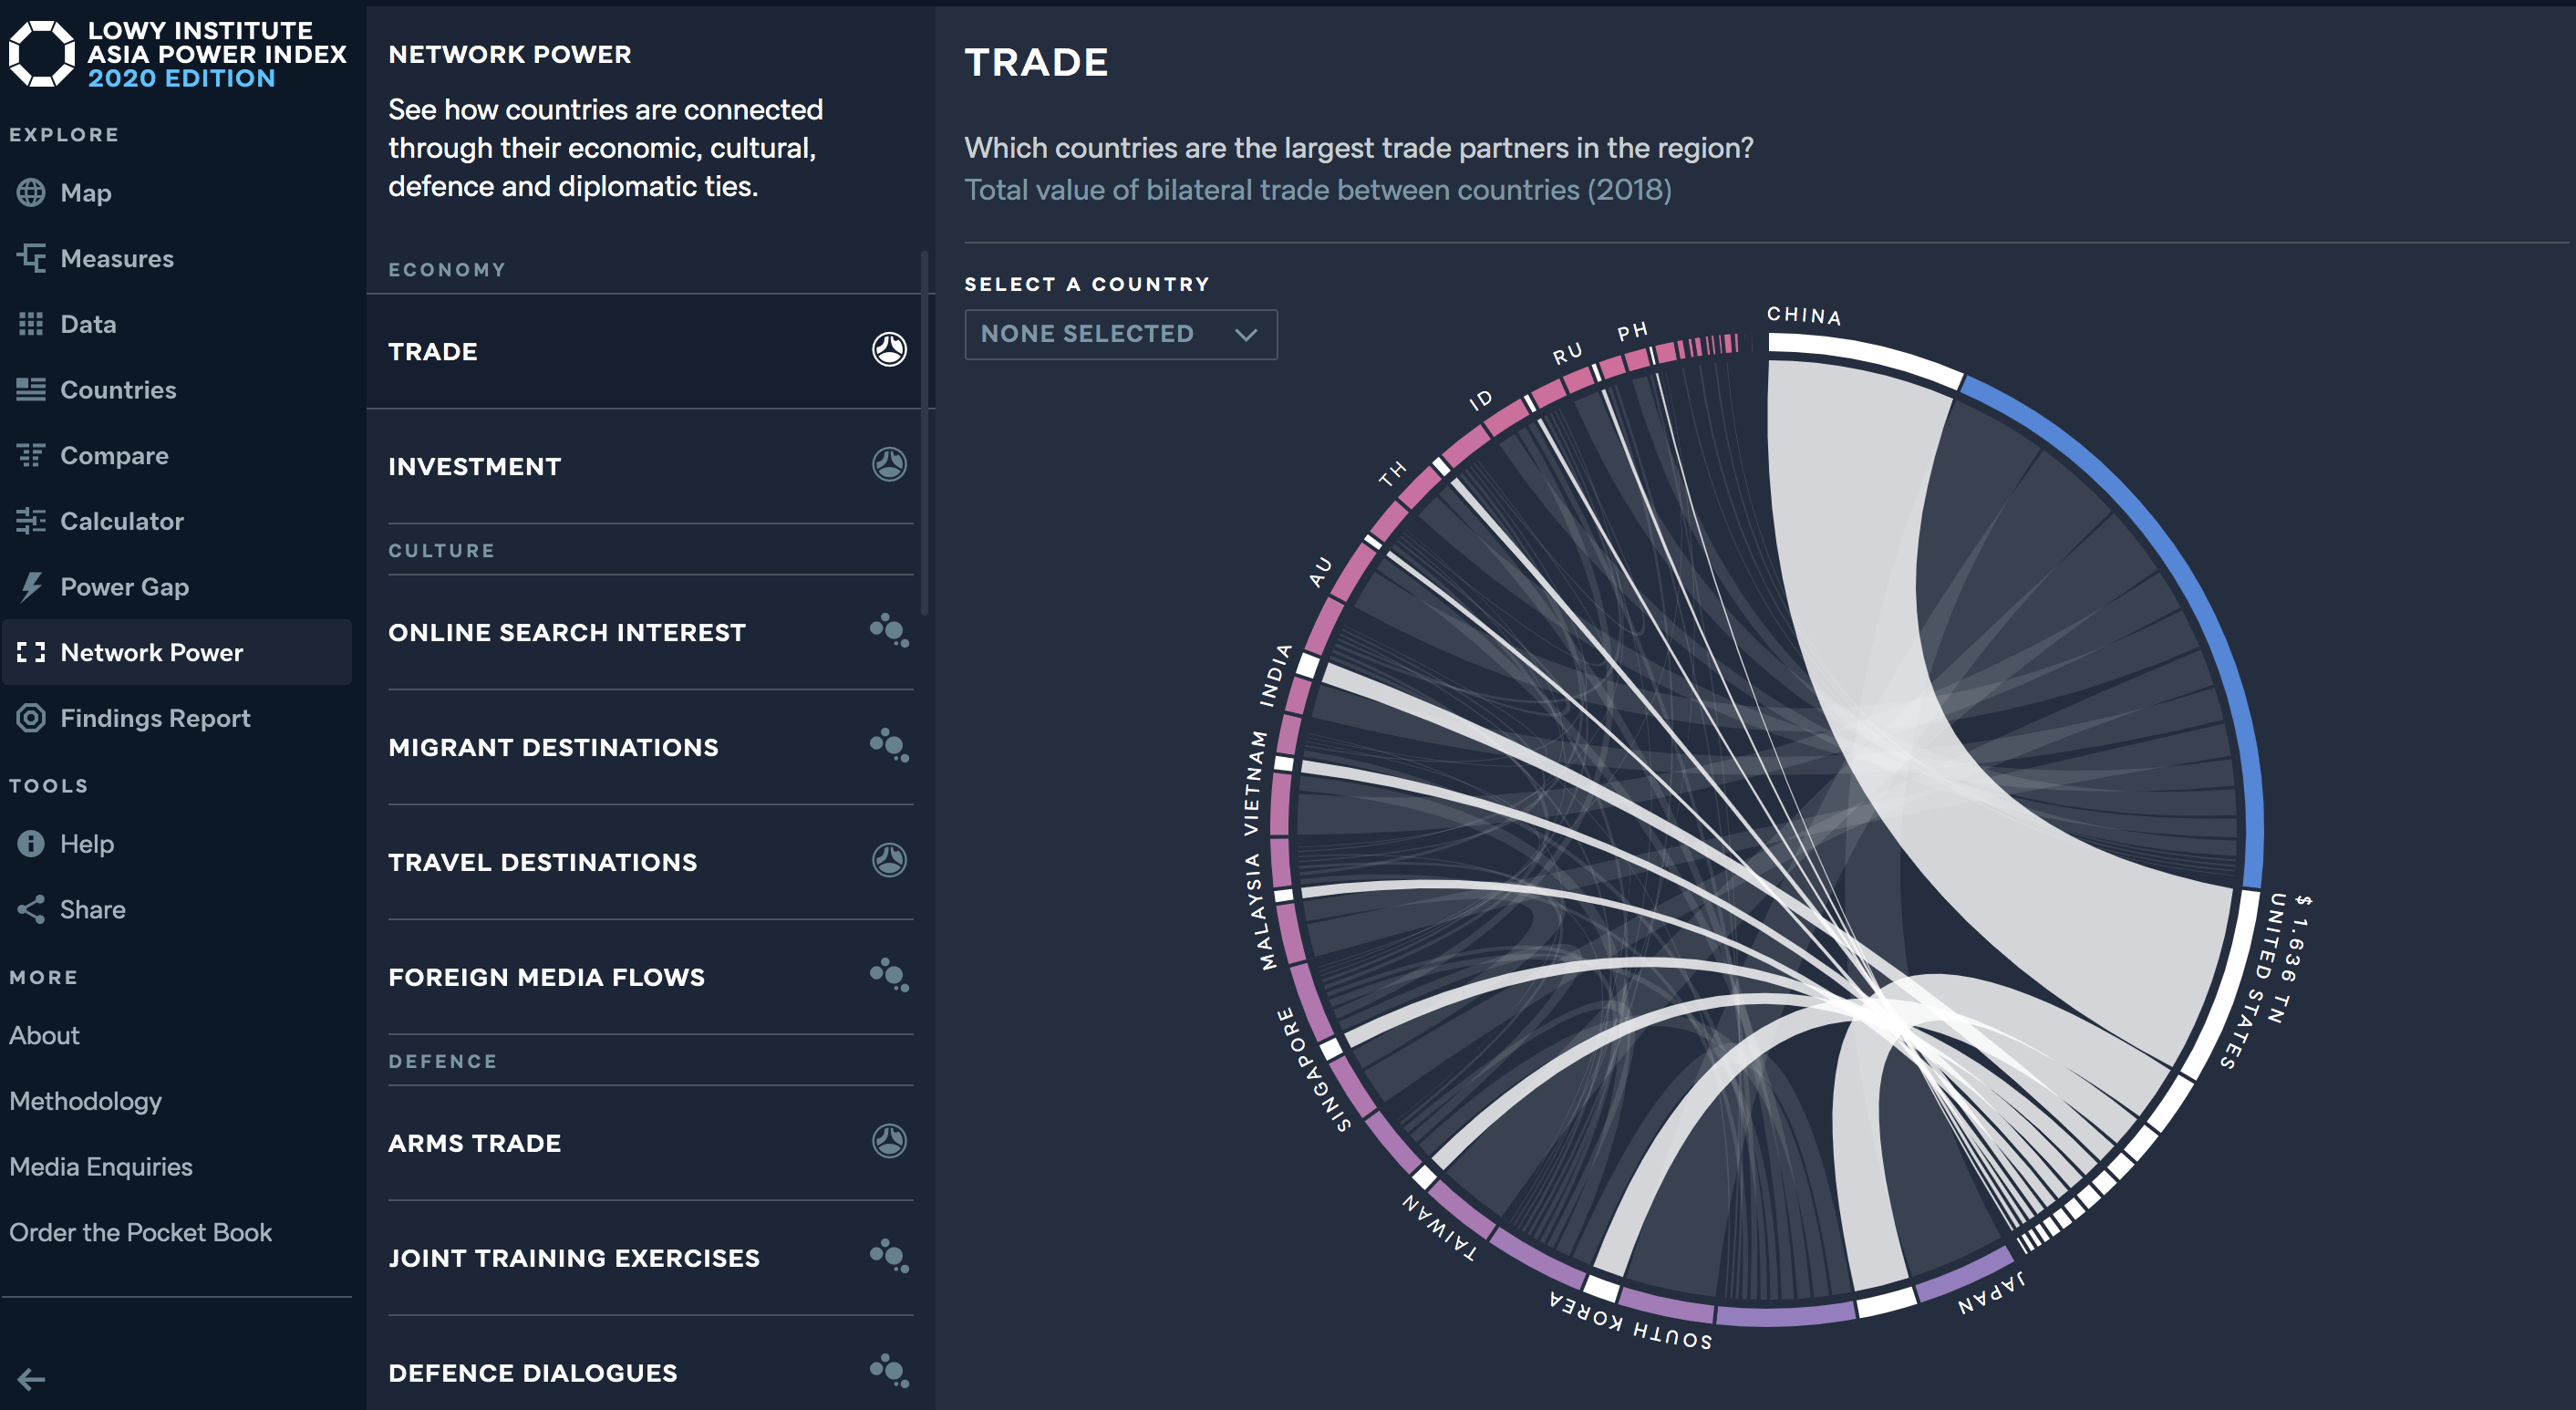
The annual Asia Power Index — launched by the Lowy Institute in 2018 — measures resources and influence to rank the relative power of states in Asia. The project evaluates international power in Asia through 128 indicators across eight thematic measures: military capability and defence networks, economic capability and relationships, diplomatic and cultural influence, as well as resilience and future resources.
The Index ranks 26 countries and territories in terms of their capacity to shape their external environment — its scope reaching as far west as Pakistan, as far north as Russia, and as far into the Pacific as Australia, New Zealand and the United States.
The project allows to choose different types of visualizations, and one of the most interesting among them is the network visualization that shows how countries are connected through their economic, cultural, defence and diplomatic ties.
Edited by Zachary P. Neal, Associate Professor, Department of Psychology, Michigan State University, US and Céline Rozenblat, Professor of Urban Geography, Faculty of Geosciences and Environment,Université de Lausanne, Switzerland
‘If you want to understand cities – the innovation and dynamism they generate and the way they sort and segregate people by class, race and other dimensions – you have to start by understanding that cities are networks. Zachary Neal and Céline Rozenblat have done all of us who care about cities a great service by pulling together the very best and brightest thinkers on cities and networks in this terrific volume.’ – Richard Florida, University of Toronto, US and author of The Rise of the Creative Class and The New Urban Crisis
This Handbook of Cities and Networks provides a cutting-edge overview of research on how economic, social and transportation networks affect processes both in and between cities. Exploring the ways in which cities connect and intertwine, it offers a varied set of collaborations, highlighting different theoretical, historical and methodological perspectives.
International contributions assess the state of the field of network analysis, presenting interdisciplinary insights that draw on theory from geography, economics, sociology, history, archaeology and psychology, and outlining methodological tools that include ethnographic, qualitative and quantitative approaches. Illustrating a framework for integrating the diversity of urban networks, the Handbook demonstrates that by exploring urban networks with different combinations of levels and scales, new insights and opportunities can emerge.
Featuring focused studies on specific regions and cities, this state-of-the-art Handbook is essential reading for scholars and researchers of urban studies and regional science, particularly those focusing on the transformation of cities as connected spaces through intracity and intercity networks. Its core theoretical insights will also benefit graduate students in urban studies and network analysis.
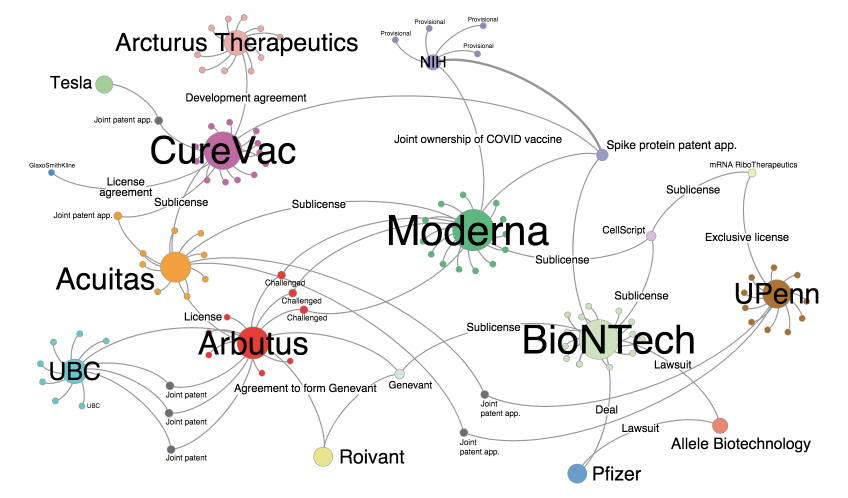
The rapid development of Covid-19 vaccines has been underpinned by an intricate web of co-patents, intellectual property agreements and lawsuits. Showing them as a network can be useful to highlight the most relevant nodes and the relations they’re embedded into. A preliminary work on this has been recently featured in Nature Biotechnology. Besides reconstructing the main actors in the production of mRNA vaccines, the authors have also analyzed the landscape of scientific terms used in mRNA patents, using a network methodology and the software VOS viewer . A heated debate is underway around the possibility to limit intellectual property rights to facilitate the access to vaccines for developing countries, and network visualization tools can greatly help in understanding the complexity of the relations at stake.
Source: Gaviria and Kilic, 2021: A network analysis of COVID-19 mRNA vaccine patents. Nature Biotechnology, VOL 39, pp. 546–549.
An interesting network interactive vizualization of philosophy where lines and connections are more important than the proximity in the network… follow each line to know more about a philosophical (sometimes literature or artistic) domain (unfortunately in French)
Electric cars are increasingly regarded as an interesting option to lower greenhouse emissions and curb pollution, especially in cities. There is often criticism, however, around a number of critical issues that would make electric vehicles not such a “green” option.
1- Some critics say that electric cars contain a number of rare earth metals whose extraction and processing are intensive in terms of energy demanded and use of chemicals. Furthermore, rare earth elements are mostly provided by China, making it a sensitive geopolitical topic. Other main ingredients in the electric car recipe include lithium, and cobalt, whose extraction also give concerns in terms of their environmental and social impact.
2- Related to the previous point, some critics say that batteries – the main component of electric cars- is not recycled and therefore we would be contributing to generating a large volume of polluting high tech wastes.
3- Where does the electricity for recharging electric cars come from? In countries that still rely on fossil fuels (such as Germany with coal) an important question is wether it is really a greener option to use electricity instead of gasoline?
A Swiss documentary addresses the way these topics are being framed by media and in the public opinion. What they found is that these criticisms are largely unwarranted or at least exaggerated. The team fully dismantled an electric car along with a conventional one, and found no traces of rare earth in the electric ones while they did find them in the catalyzer of the fuel one. Besides, they went to Congo to find that accusations of child labour in cobalt mines are only a marginal part of the story, whereas in Chile they discovered that Lithium production is not so polluting as portrayed. Eventually, the documentary makes the viewer ask the question of: why do I know what I know? Why do conventional and social media give so much attention to negative stories in order to throw bad light on electric cars without questioning conventional ones?
You can watch their trailer below (french only for the moment), and you can find here a list of their sources.
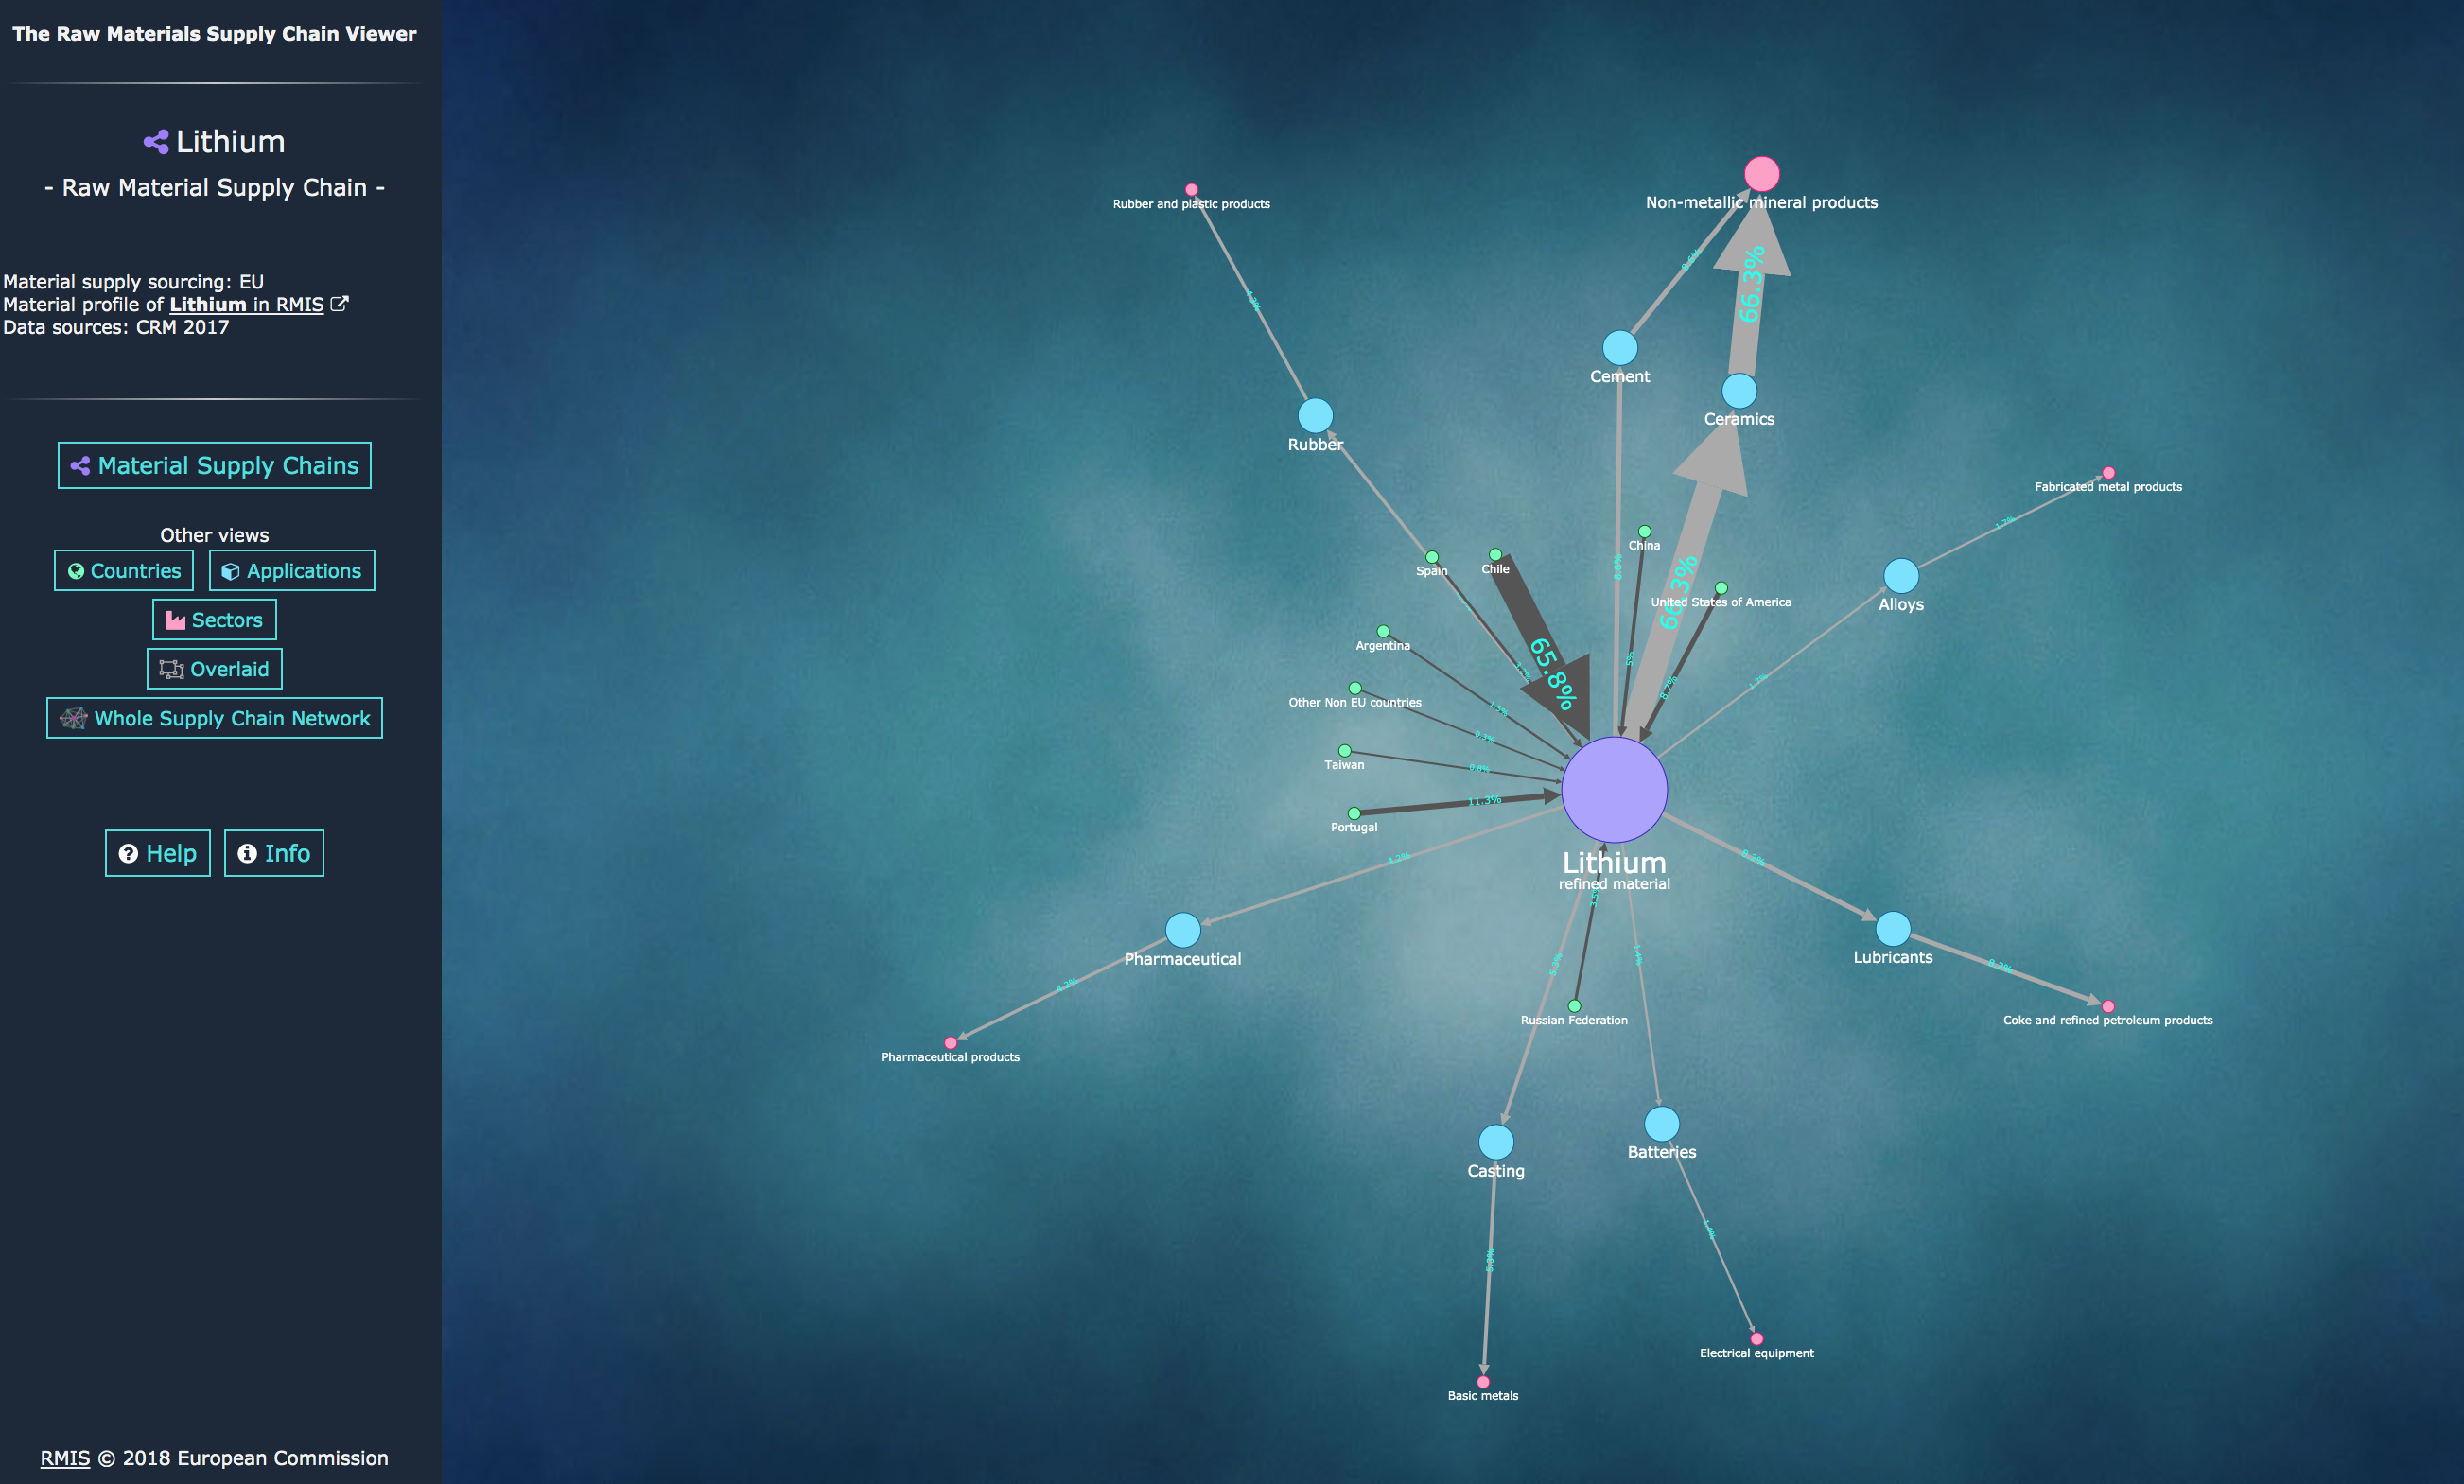
The European Union has recently acknowledged the strategic role of a number of critical raw materials that are used in the ICT, energy and defense industry. As a result, the Joint Research Center of the European Commission has set up a Raw Materials Information Center that collects legal, economic, trade and policy data on strategic raw materials. A particularly interesting tool is the Supply Chain Viewer, that allows to visualize the global production network of a number of raw materials along with the countries of production and the sectors in which they are employed.
“The raw materials Supply Chain Viewer (SCV) provides an overview of networks of selected raw materials supply chains, consisting of supplying countries, material products, product applications, and economic sectors using such products and materials.
Conceptually, this type of data representation is forming a directed graph, i.e. a network consisting of nodes or vertices (four different types, namely countries, materials, applications and sectors) connected together. These connections (named either links or edges) are representing the flows associated to a specific material. More precisely, in technical terms, this is referred to as an acyclic, connected and oriented graph, i.e. a directed graph without multiple/symmetric edges or loops.[5]
Data for the linkages among countries, materials, product applications and sectors were selected mainly from the EC criticality assessment (CRM 2017)[1]. Such underlying data refer to the period 2010-2014. For several cases, where data were not reported in the CRM 2017, missing data were collected from BGS[3] or Eurostat[4]. On each link, a detailing popup displays the data source. In the SCV graph, data is comprised in the connecting links and not in the nodes, these being simply connecting points in the network[2].”
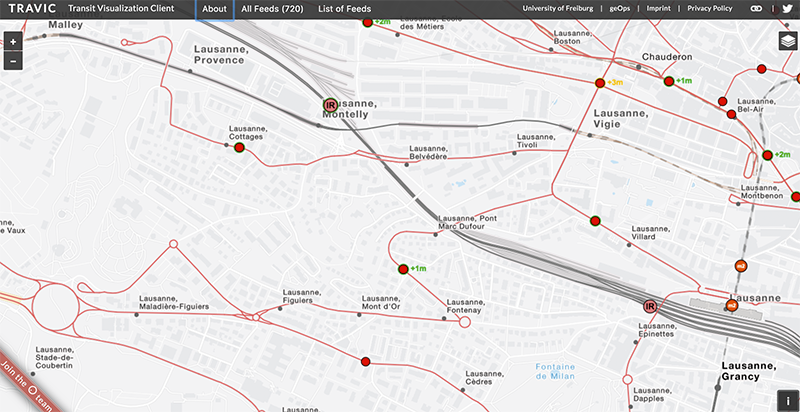
TRAVIC is a real-time tracker of public transport that allows the user to visualize the movement of trains, buses, trams and boats all over the world. It is based on a master thesis project by Patrick Brosi in a collaboration between the Swiss based geoinformatics company Geops with the University of Freiburg, Germany. For background information on how TRAVIC is done you may check their blog.
This tracker provides movement visualization of transit data published by transit agencies and operators from all over the world. The movements are mostly based on static schedule data but for some countries, such as for example the Netherlands, real-time data is available and included in the visualization.
Enjoy the visualization, and let us know how you used this tool and what its applications could be.
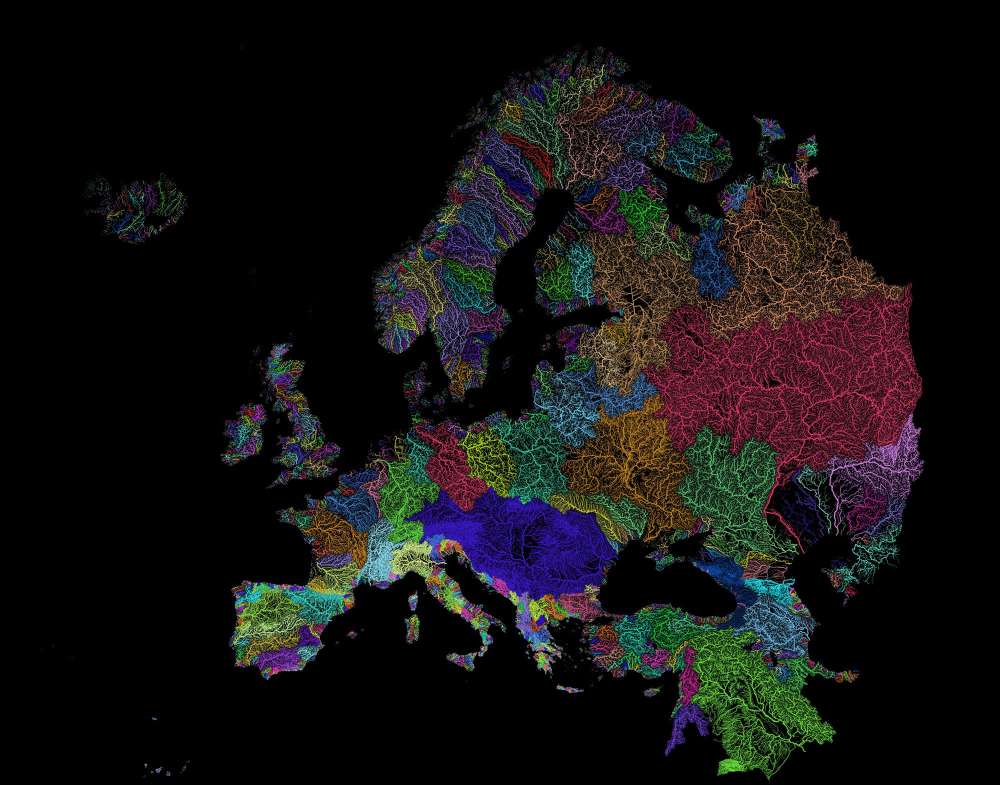
Rivers are fundamentals in creating the right conditions for life: that is why most cities since ancient civilizations were built along their banks. Rivers form intricate networks linking the main branches and their smaller tributaries. These river webs have been mapped by geographer Szűcs Róbert, dividing our planet’s watersheds into colorful catchment areas, and providing an informative look at how water flows across continents.
Check out the full article on visual capitalist, and take a look at Robert’s wonderful maps!
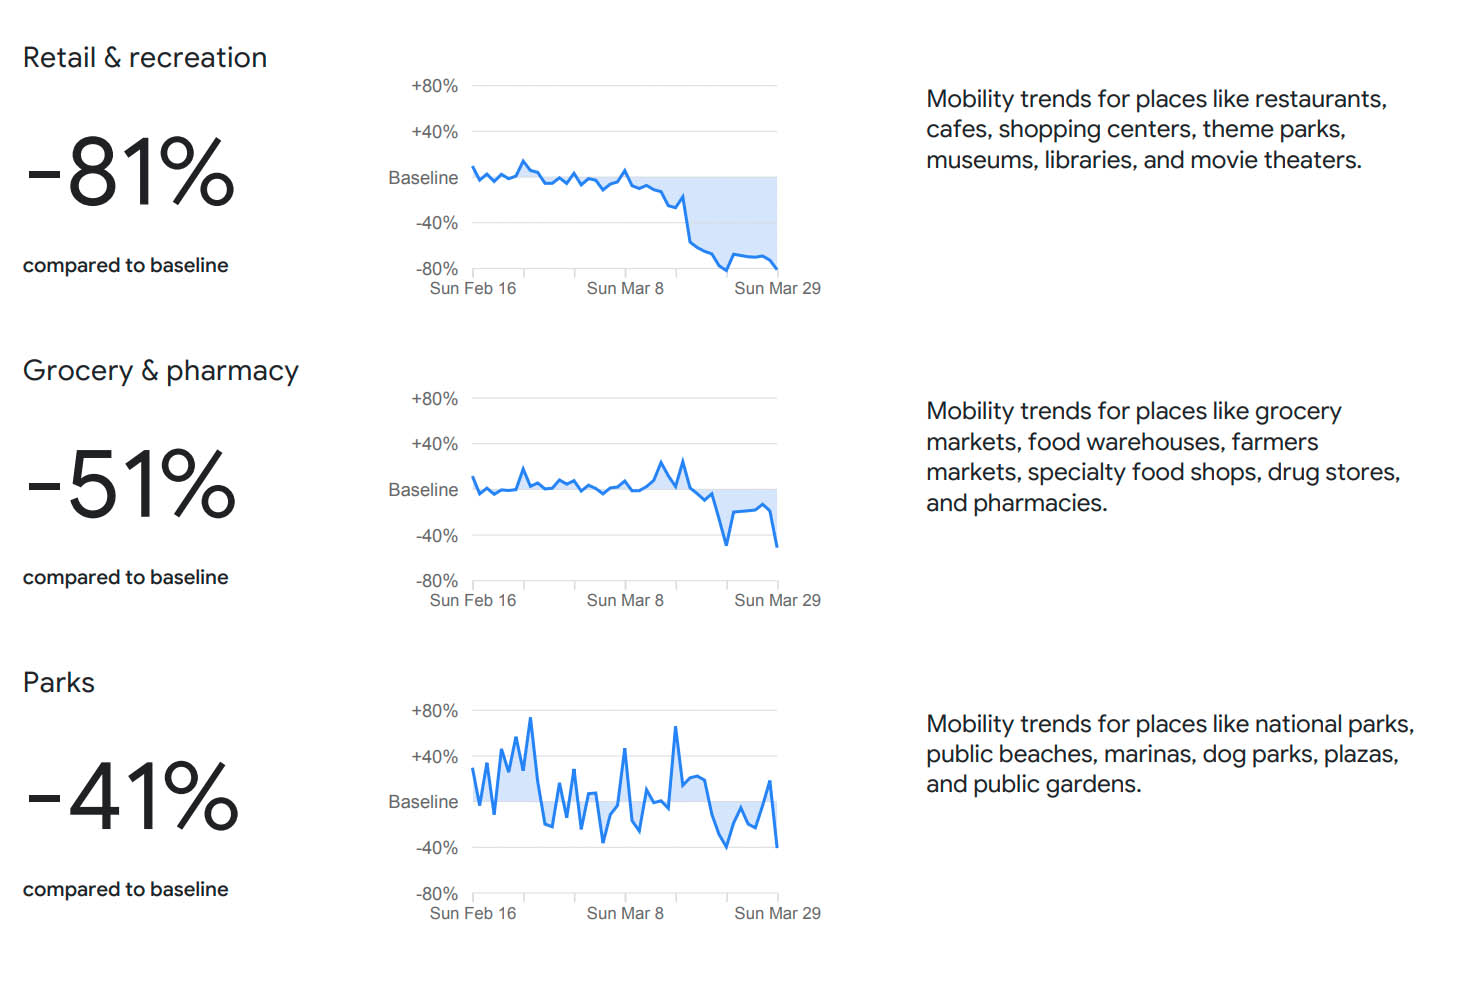
Last week Google has published the “COVID-19 Community Mobility report”. In the context of strict confinement measures, and while some governments (China above all but also Italy, France and Spain) have resorted to mobile phone data to assess whether citizens are respecting the lockdown, Google has published anonymized mobility data from a number of countries showing the effect of limitations on individual movements.
The reports use aggregated, anonymized data to chart movement trends over time by geography, across different high-level categories of places such as retail and recreation, groceries and pharmacies, parks, transit stations, workplaces, and residential. We’ll show trends over several weeks, with the most recent information representing 48-to-72 hours prior. While Google displays a percentage point increase or decrease in visits, they do not share the absolute number of visits. To protect people’s privacy, no personally identifiable information, like an individual’s location, contacts or movement, is made available at any point.
In Switzerland, for example, data are available on a national and canton basis, and they show a clear decrease in mobility patterns since the beginning of the lockdown on March 16.
What about your country or local area?
You can access all reports at https://www.google.com/covid19/mobility/
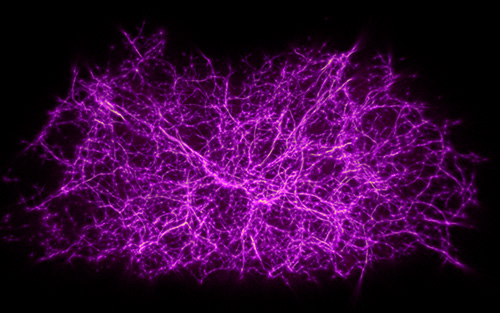
Is there a relation between a yellow slime organism called Physarum polycephalum, that can be easily found on decaying trees and leaves in the forest’s shade, and the complex organization of galaxies?
Researchers Joe Burchett and Oskar Elek at the University of California at Santa Cruz created a 3D algorithm that represents how the slime builds its networked structures in space. Then, they applied the algorithm to a dataset of 37.000 galaxies, finding a rather precise representation of the cosmic web. In the words of one of the authors:
“That was kind of a Eureka moment, and I became convinced that the slime mold model was the way forward for us,” Burchett said. “It’s somewhat coincidental that it works, but not entirely. A slime mold creates an optimized transport network, finding the most efficient pathways to connect food sources. In the cosmic web, the growth of structure produces networks that are also, in a sense, optimal. The underlying processes are different, but they produce mathematical structures that are analogous.”
This is an interesting step towards understanding the laws of complexity and how they create similar structures across scales. Read the full contribution here.
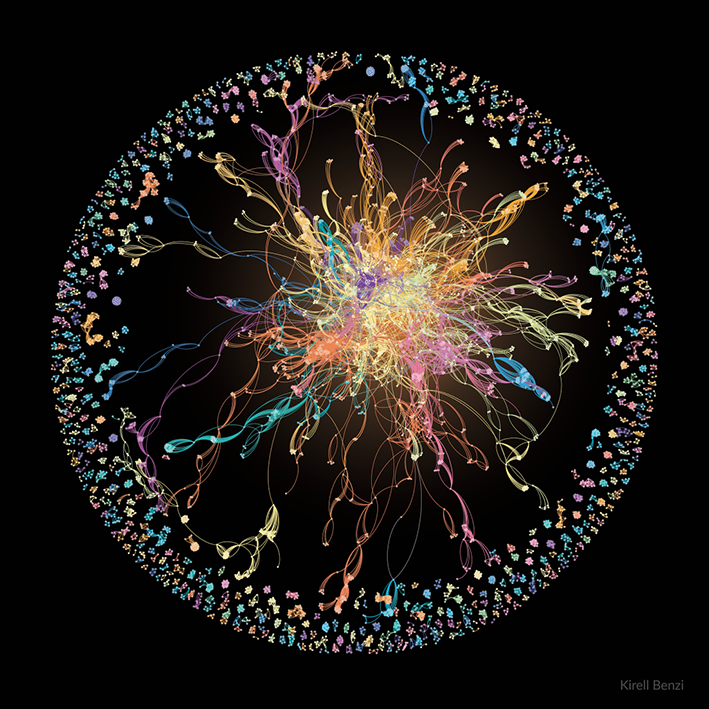
Kirell Benzi is a data artist, speaker and data visualization lecturer. He holds a Ph.D. in Data Science since 2016, which he obtained at EFPL (Ecole Polytechnique Fédérale de Lausanne).
Building on very heterogeneous datasets (collaborations between musicians, patents, corporate links and much more) Kirell created a number of artistic network visualizations in which the insights from data are powerfully supported by the strength of the representation.
Please visit his outstanding network art gallery at: https://www.kirellbenzi.com
The featured image shows the network of Montreux Jazz musicians:
“This network shows with whom musicians of the festival play with, revealing two different categories of artists. At the border of the ring, we have the artists who only perform with their band, forming many disconnected communities. On the opposite, those who jam with everyone, the stars of the festival, are well-connected and are naturally located in the center of the ring. One of the brightest stars was George Duke, the champion of appearances at the festival with 53 concerts. In the center in orange, he faces the legendary guitarist Santana in purple.”
A recently published study in Current Biology has shown that a species of termites has been colonising a huge area of Brazil – its surface is equivalent to that of Great Britain- in the past 4000 years. The visible results of this work consist in a large number of earth mounds that can be up to 3 meters tall and 9 meters in diameter which are not nests but rather represent the accumulation of waste material from the insects’ construction of the underground network. The mainreason for this impressive effort is, according to the researchers, to stock and safely consume leaves that fall only during a short seasonal interval. This case show the impressive capability of certain species to collectively transform and adapt their environments by creating permanent structures that can persist for thousands of years. Ants or bees have often been associated to humans for their complex social organisation, division of labour and structure. Therefore, can we obtain some interesting insights and inspiration from these impressive spatial constructions that are even older than the pyramids?
In this article on Nature, author Alessandro Vespignani elaborates on the importance of this contribution in opening up the multidisciplinary field of what is today known as “network science”.
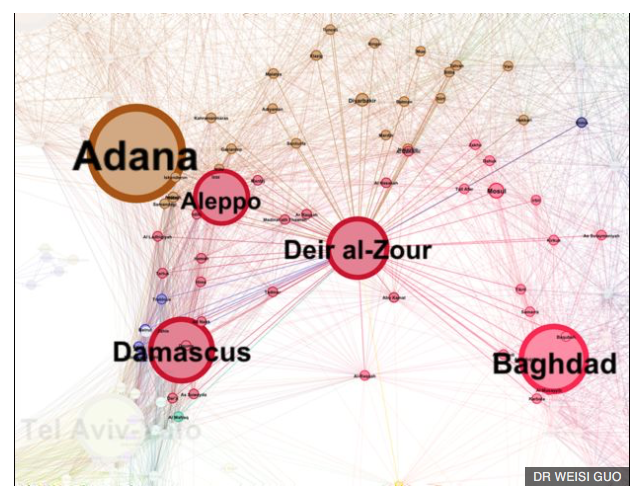
When we consider the global network of cities, is instability an inherent property of certain network positions?
Dr. Weisi Guo from Cardiff University believes this is the case. He recently co-authored a study in which he found that cities with a high network betweenness – that are centrally located in a path that connects different cities in the network- are more likely to display high levels of violence, including war, terrorism and gang violence. On the other hand, cities with a high degree –or having connections to many other cities – were found to display a low level of violence.
How to interpret these results? the authors develop an agent based model that suggests that cities with fuzzy cultural boundaries, that serve as connections between culturally homogeneous areas, are indeed those with a higher level of betweenness. On the contrary, cities that are more culturally homogeneous turned out to show also a higher degree.
Even if the authors warn against the attempt to establish causality, which cannot be assessed by the study, their methods accurately identify some of the world’s current foci of conflicts such as Damascus, Aleppo and Baghdad but also Veracruz and Tegucigalpa, in central America. Also, the authors identify a number of cities that do not show at present a high level of violence but which might in the future such as La Mecca and Jeddah in Saudi Arabia, Teheran or Kunming in China.
Their study has been extensively covered by BBC here
Also, you can access the full study, titled “The Spatial Ecology of War and Peace” here.
If you want to know more about the authors, they are:
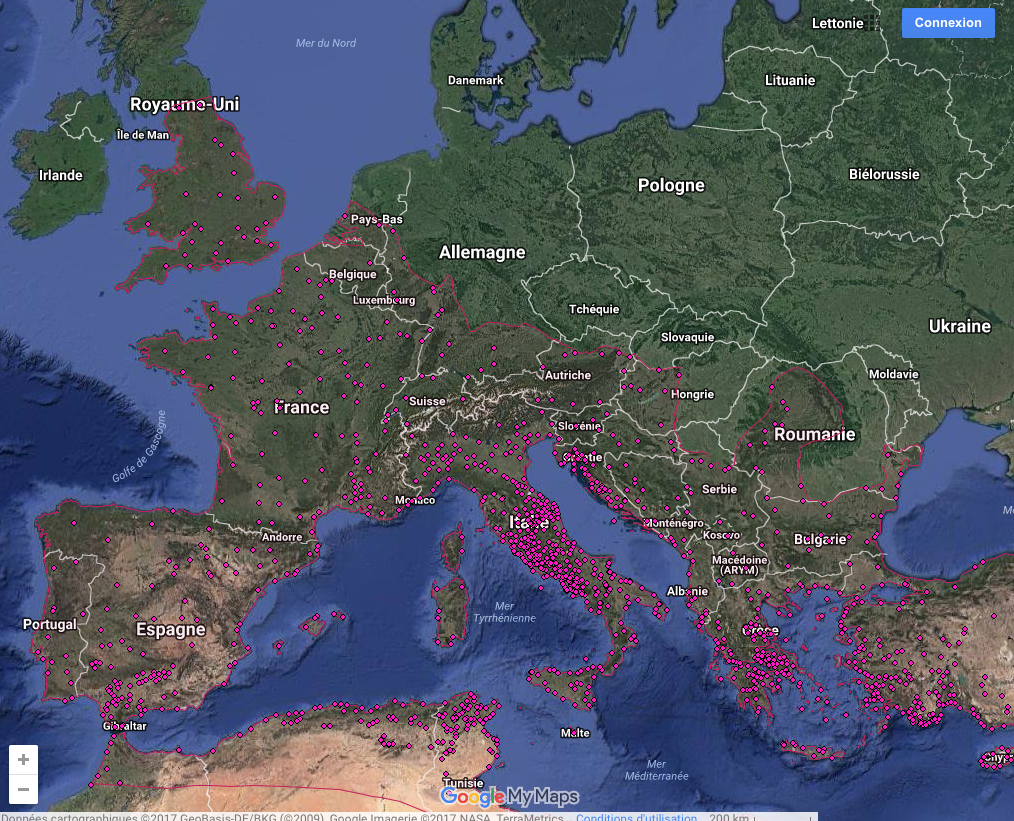
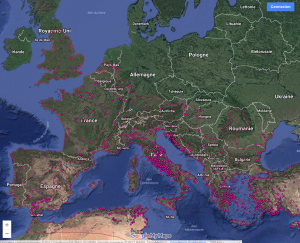
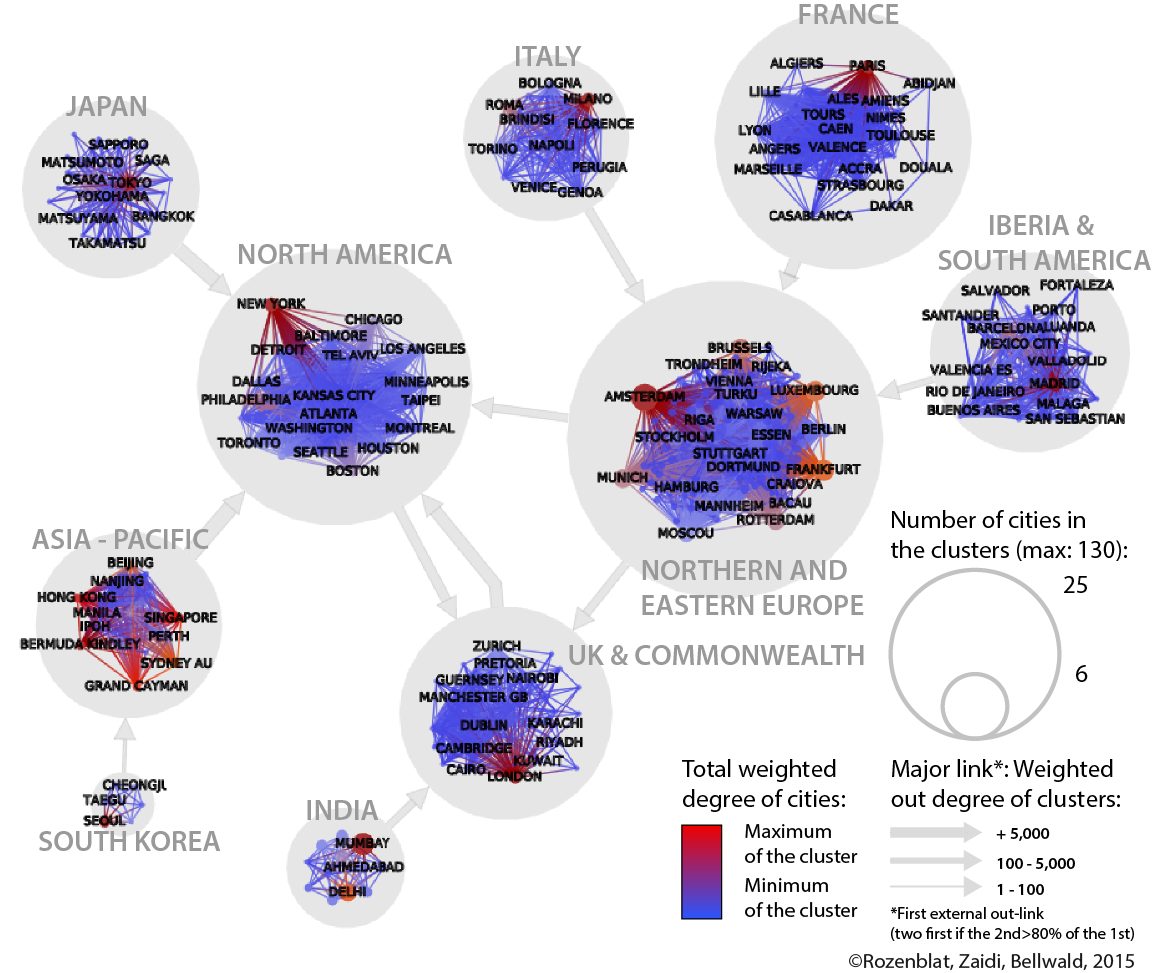
Rozenblat, C., Zaidi, F., & Bellwald, A. (2017). The multipolar regionalization of cities in multinational firms’ networks. Global Networks, 17(2), 171-194.
For those who missed the session Territorial Intelligence for Multi-level Equity and Sustainability, you can visualize online individually each presentation :
Denise Pumain, University Paris 1. ERC GeodiverCity (Keynote Speaker – Conference CS-DC)