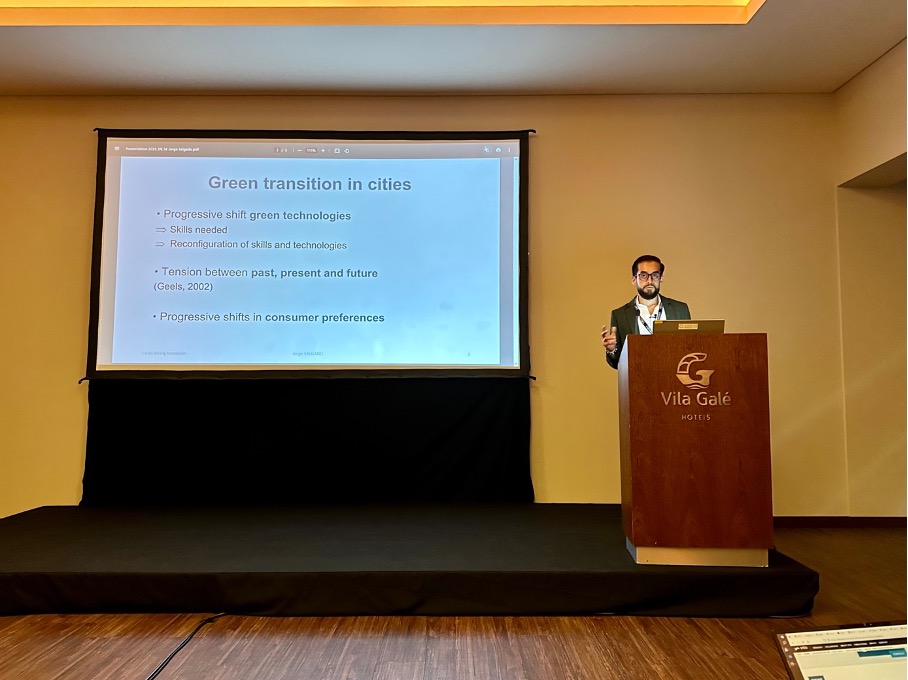
At the European Colloquium of Theoretical and Quantitative Geography 2023 (ECTQG, 2023), Jorge Salgado – researcher at Citadyne – presented the progress of his research entitled: “Cities in the face of green technologies, skills and preferences transitions: a multilevel complex approach”. His agent-based modelling approach allows the simulation of changes in firms technologies and consumer preferences as a result of the green transition. The research has been well received because it simultaneously integrates key elements of the economic system, enabling bottom-up interactions to understand the reconfiguration of urban systems around the world.
If you are interested in this research you can contact Jorge Salgado:
Measuring the Value of Location Data: A Step-by-Step Guide
The UK’s Geospatial Commission – part of the Department for Science, Innovation and Technology – has recently published a framework to advise the UK government on the most productive and economically valuable uses of geospatial data. This effort is a result of commitments made in the UK’s Geospatial Strategy, published in 2020 and reiterated in the 2022/23 Annual Plan of the Commission.
To address this major challenge and given the growing importance of location data in sectors as diverse as urban planning, transport and public services. The Geospatial Commission presents a step-by-step approach to effectively measure the value of location data. It emphasizes the importance of considering both economic and non-economic factors in the valuation process.
The framework includes aspects such as data quality, usability, accessibility and societal impact to provide a holistic view of the value of location data. According to the Commission, “assessing the value of location data is difficult because: (i) value is often only realized when location data is combined with other data sets, (ii) value varies depending on the intended use, and (iii) value can be difficult to predict”.
In response to these challenges, the methodology for measuring the value of location data covers key components such as data collection, data management, data analysis and data use. It also emphasizes the integration of location data with other datasets and the use of advanced technologies, such as artificial intelligence and machine learning, to unlock its full potential.
The framework guide, a summary of its steps, its application and results can be found at the following link:
Ex Machina: Coevolving Machines & the Origins of the Social Universe
John H. Miller recently published “Ex Machina: Coevolving Machines & the Origins of the Social Universe,” in which he combines ideas from the study of games, the foundations of computation, and Darwin’s theory of evolution to introduce a methodology for studying systems of adaptive, interacting, choice-making agents, and uses this approach to identify conditions sufficient for the emergence of social behavior. In his words, he explores how evolving automata can go from asocial to social behavior and finds that systems of simple adaptive agents can be rapidly transformed into a rich social world.
John H. Miller is an economist from the University of Colorado. He received his Ph.D. in economics from the University of Michigan in 1988, where he worked with Ted Bergstrom and Hal Varian. He joined the Santa Fe Institute as its first postdoctoral fellow. He has been associated with the Institute ever since. He joined Carnegie Mellon University as an assistant professor in the Department of Social and Decision Sciences, later becoming a professor in 2000.
You can find out more about this book by visiting the following website:
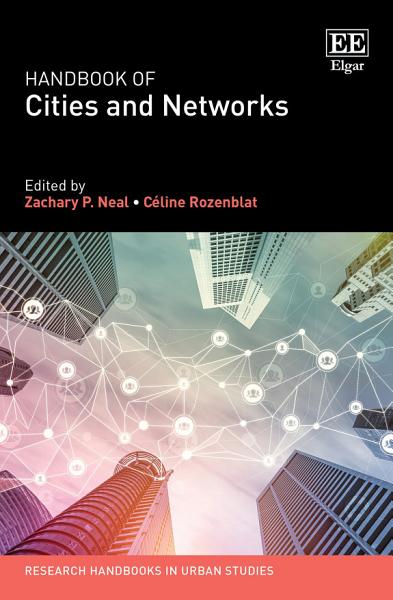
Edited by Zachary P. Neal, Associate Professor, Department of Psychology, Michigan State University, US and Céline Rozenblat, Professor of Urban Geography, Faculty of Geosciences and Environment,Université de Lausanne, Switzerland
‘If you want to understand cities – the innovation and dynamism they generate and the way they sort and segregate people by class, race and other dimensions – you have to start by understanding that cities are networks. Zachary Neal and Céline Rozenblat have done all of us who care about cities a great service by pulling together the very best and brightest thinkers on cities and networks in this terrific volume.’ – Richard Florida, University of Toronto, US and author of The Rise of the Creative Class and The New Urban Crisis
This Handbook of Cities and Networks provides a cutting-edge overview of research on how economic, social and transportation networks affect processes both in and between cities. Exploring the ways in which cities connect and intertwine, it offers a varied set of collaborations, highlighting different theoretical, historical and methodological perspectives.
International contributions assess the state of the field of network analysis, presenting interdisciplinary insights that draw on theory from geography, economics, sociology, history, archaeology and psychology, and outlining methodological tools that include ethnographic, qualitative and quantitative approaches. Illustrating a framework for integrating the diversity of urban networks, the Handbook demonstrates that by exploring urban networks with different combinations of levels and scales, new insights and opportunities can emerge.
Featuring focused studies on specific regions and cities, this state-of-the-art Handbook is essential reading for scholars and researchers of urban studies and regional science, particularly those focusing on the transformation of cities as connected spaces through intracity and intercity networks. Its core theoretical insights will also benefit graduate students in urban studies and network analysis.
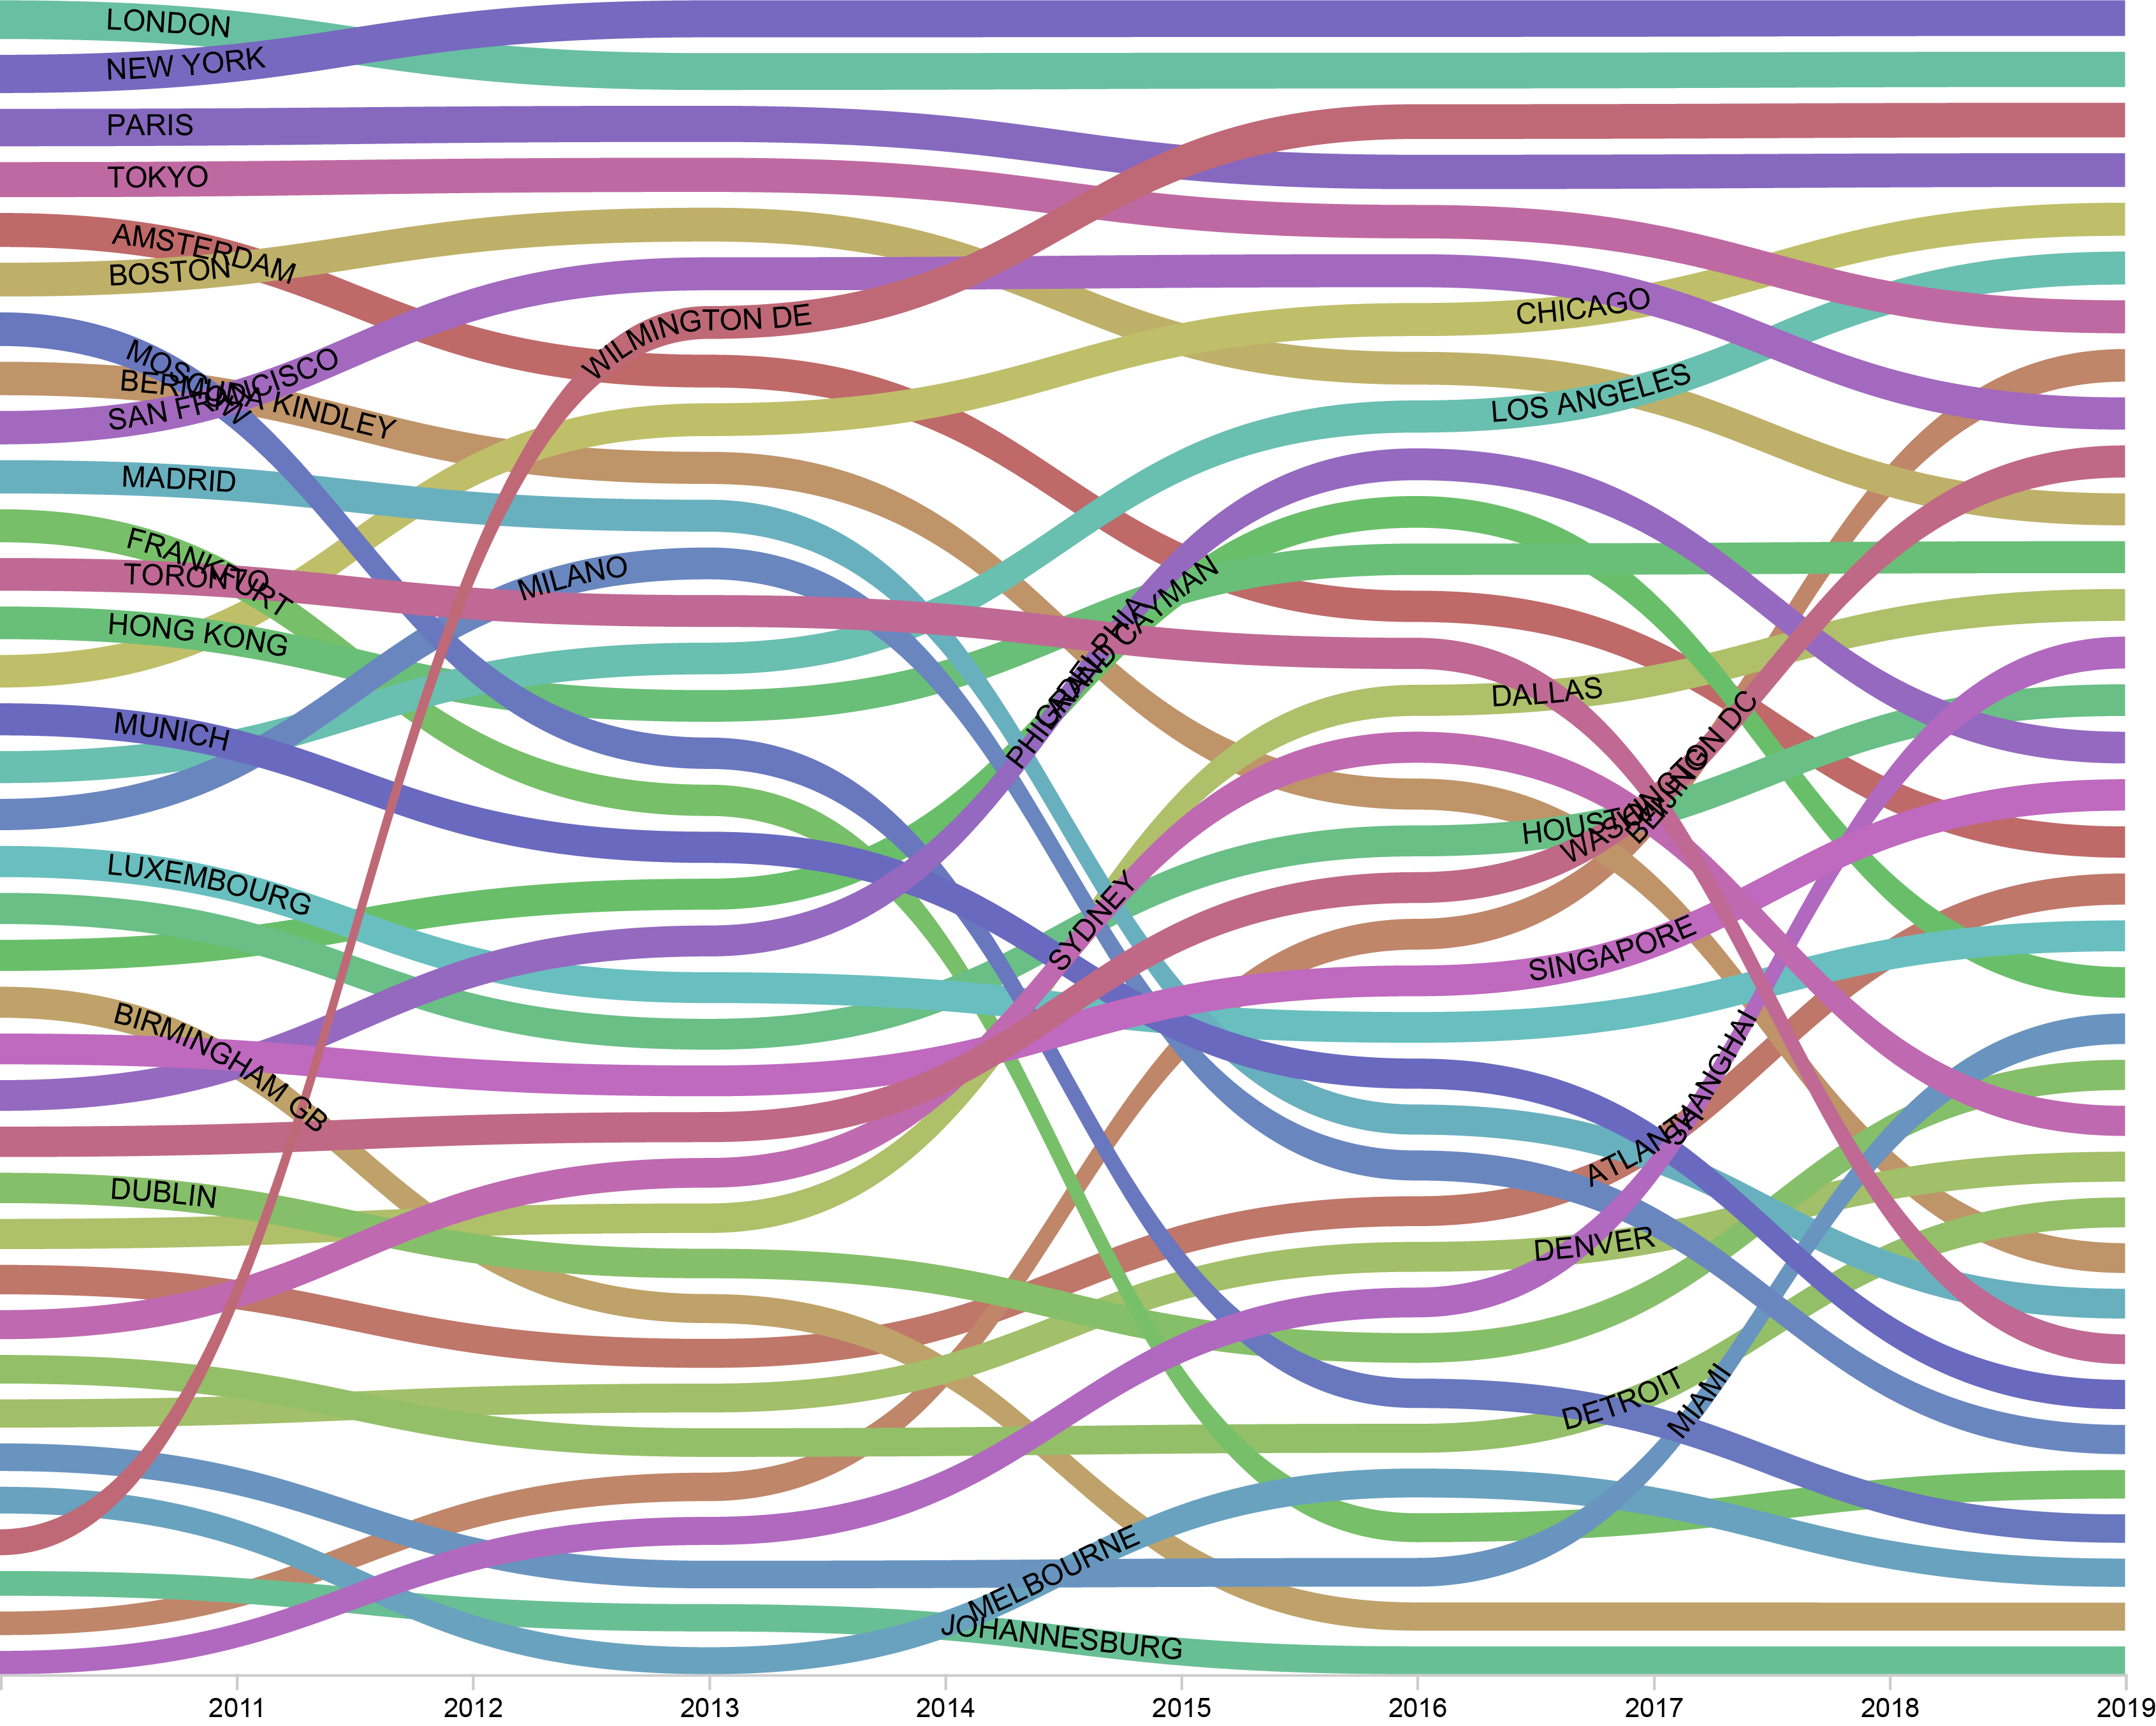
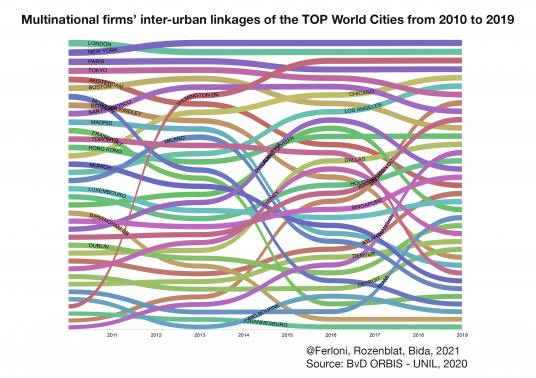
Are you interested in data visualization and you would like to experiment with different charts? Then you might give RawGraph a go. This web-based application lets you import your data, choose between different charts to visualize it, customize it and export it in svg format, ready to publish or further improve.
RawGraph is now available in a 2.0 beta version, but help pages include examples and tutorials for the previous one, so if any problems arise in the version 2.0 you might want to begin exploring the older 1.0 version.
Using RawGraph 1.0 we generated an explorative bumpchart showing the evolution in the number of multinational’s firms inter-urban linkages (logged on Y axis) of different Large Urban Regions from 2010 to 2019. London, New York, Paris and Tokyo are unsurprisingly at the top positions. On the other hand, the performance of Wilmington Delaware would be surprising if we didn’t know that it is one of the world’s leading tax havens and corporate friendly locations. Chinese cities such as Shanghai and Beijing also show sustained growth while Moscow sharply decreases its foreign linkages most likely because of the effects of international sanctions following the Ukraine war in 2014.
The global pandemic caused by the spread of Covid-19 disease has implied a dramatic reduction of air travel all over the world. Companies have been forced to shrink their operations to the bone, while images of grounded airplanes became the norm. This forced stop will likely have long term consequences and bring to a general restructuring of air transportation. In this contribution three academic experts discuss some of the main issues in this debate:
With most airline companies struggling to survive, some governments have already announced loan or bailout plans, while others have (re)nationalized them or are planning to do so. Yet another approach to the matter is to leave it in the hands of the market and allow these companies to fail. This debate is important because, after the bailout of banks in the aftermath of the financial crisis of 2008, the public opinion might question the opportunity of adopting a “too big to fail” strategy implying a huge allocation of public resources to private companies.
The high contribution to CO2 emissions by aviation has been a recurring target of environmental movements in the past years. After months – and possibly years- of public spending to support economies damaged by the global lockdown, the public opinion might be favorable to introduce higher taxes and restrictions to airplane travel.
On the demand side, will the disposition to fly ever come back to pre-coronavirus levels? The tourism industry is unlikely to recover soon, and people might think twice before boarding a busy airplane again. Business travelers, on the other hand, might find it preferable to hold meetings online, consolidating habits that have developed during lockdown.
This article contributes to these issues and stimulates further reflection on the future of air transportation. Have a good read.
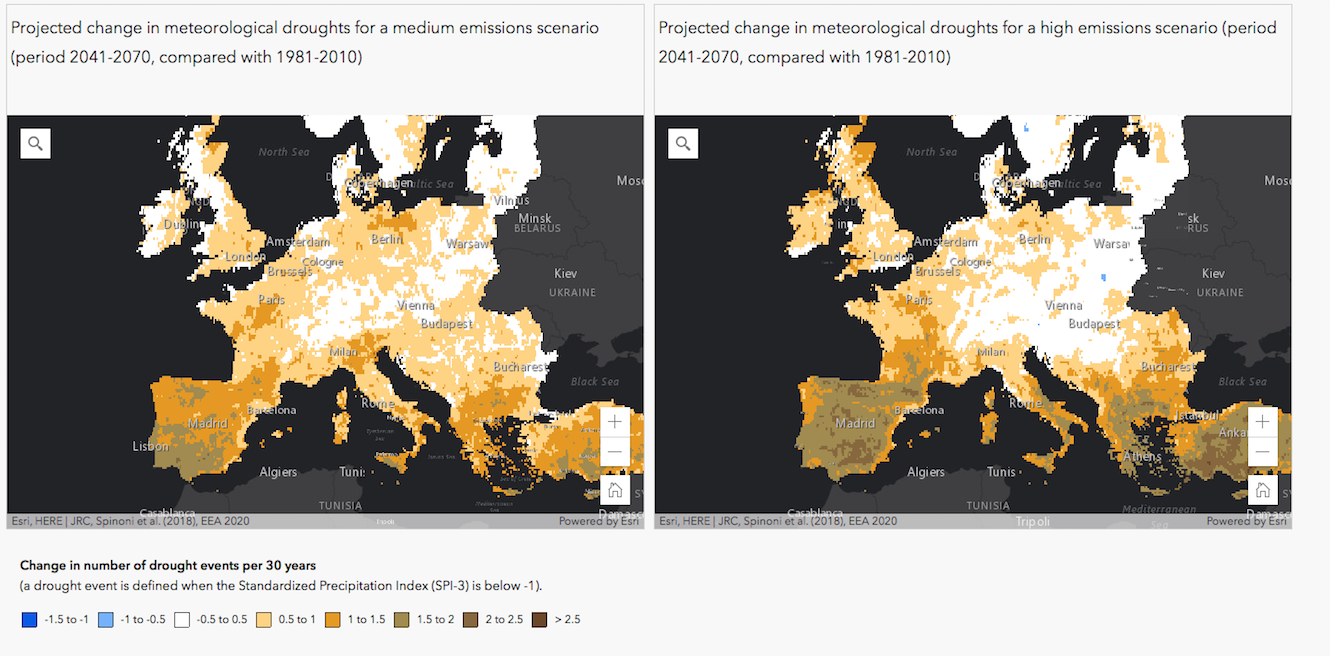
The European Environmental Agency has recently published a cartographic platform to map the impact of global warming on droughts, floods, agriculture, forest fires and sea level rise in Europe. These maps are based on different greenhouse gas emissions scenarios (medium or high) and refer to the expected changes in the period 2041-2070 as compared with the period 1981-2010. Data and climate models and have been published already in various EEA reports and indicators. Based on these maps, what are the challenges that your region faces and how to adapt to them?
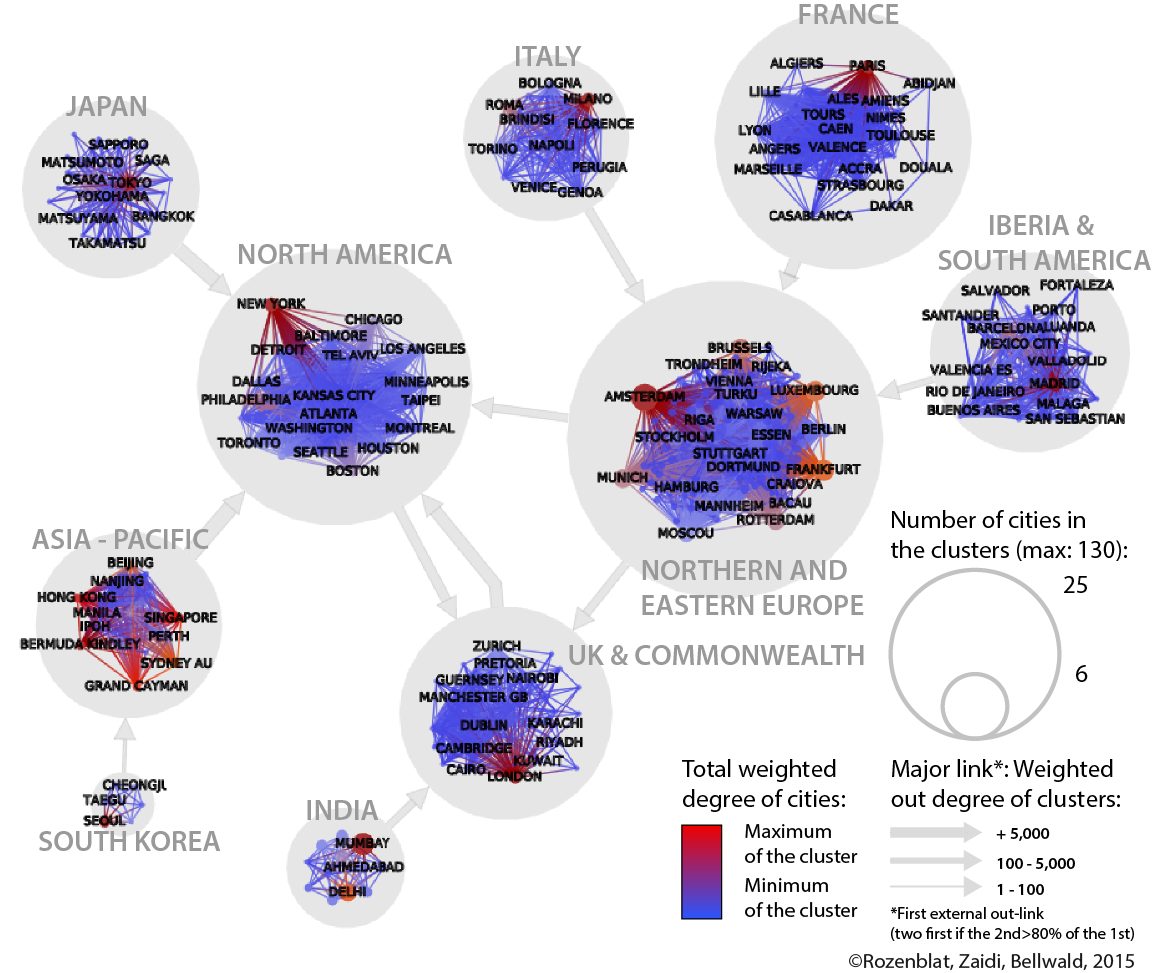
Rozenblat, C., Zaidi, F., & Bellwald, A. (2017). The multipolar regionalization of cities in multinational firms’ networks. Global Networks, 17(2), 171-194.
For those who missed the session Territorial Intelligence for Multi-level Equity and Sustainability, you can visualize online individually each presentation :
Denise Pumain, University Paris 1. ERC GeodiverCity (Keynote Speaker – Conference CS-DC)