Categories
Books Cities Social science Urban

Mapping of 15-Minute City Practices

According to the University College of Estate Management (UCEM, 2024), the concept of the 15-minute city was revitalized in 2016 by researcher and professor Carlos Moreno and received considerable attention during the COVID-19 pandemic. Presently, urban planners globally are implementing this model, awakening an intense debate in favor and against it. This concept traces its origins to Ebenezer Howard’s work, ‘Garden Cities of Tomorrow,’ published in 1902, and is further developed through Clarence Perry’s notion of the Neighborhood Unit in the 1920s, which aimed to create self-sufficient neighborhoods.

The Driving Urban Transition (DUT) Partnership recently released a report titled “Mapping of 15-Minute City Practices”, providing an exhaustive overview of the 15-minute city framework, supplemented by case studies from 100 cities. This report focuses on enhancing urban life locally through improvements in mobility, urban planning, logistics, and governance. It underscores a significant adoption of the framework, particularly in Europe, and emphasizes the critical role of social inclusion and innovative strategies.

Full details and further insights are available in the complete publication:

https://dutpartnership.eu/news/new-publication-mapping-of-15-minute-city-practices

To check the research of Carlos Moreno, follow this link:

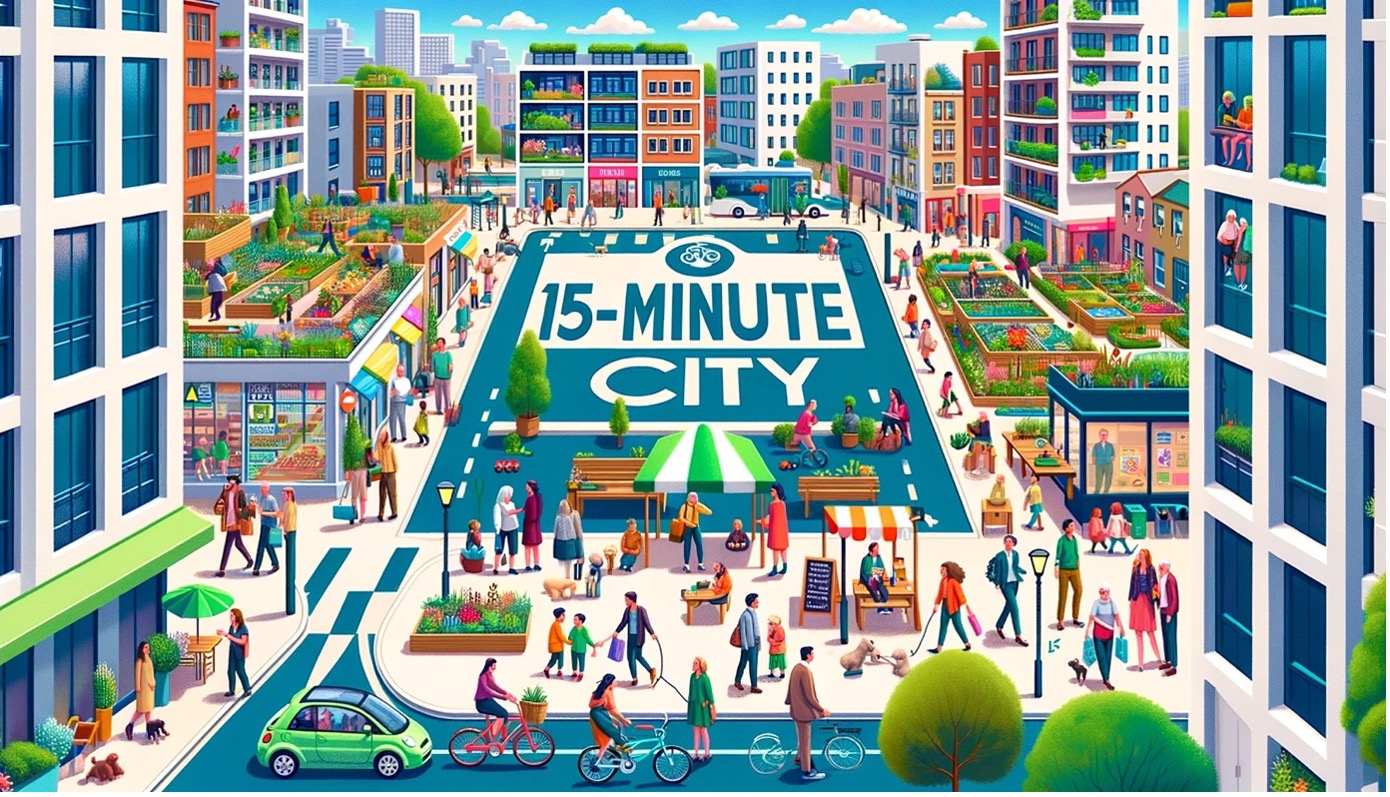
Made in OpenAI, prompt: Jorge Salgado.

References:

University College of Estate Management (UCEM, 2024). A guide to 15-minute cities: why are they so controversial? https://www.ucem.ac.uk/whats-happening/articles/15-minute-city/

Categories
Cities Health Society Urban

MOOC – Healthy Urban Systems Part III

The MOOC – Healthy Urban Systems Part III is now available on Coursera:

https://www.coursera.org/learn/healthy-urban-health-systems-3

You will learn to:

  • Design Adaptive Health Scenario
  • Produce a health system – workshop-style
  • Implement urban health policy in a systemic way
  • Develop health Impact assessments (HIA)
  • Health prevention and promotion

Dedicated to all levels of disciplines linked to the city, health, the environment, social and human sciences, data sciences…

The MOOC is entirely in English, with possible subtitles in French and Chinese.

Materials: videos, glossary, quizzes, exercises, discussion forum

Duration: 4 weeks – 1 session per week to be taken at your convenience

Workload: 2 to 3 hours per week

Accreditation (possible and not compulsory): 2 ECTS for PART II, issued by the University of Lausanne via COURSERA (US$ 25)

General coordination:

University of Lausanne – UNIL-EPFL Foundation for Continuing Education

Prof. Céline Rozenblat, Jeff van de Poel

Categories
Cities Complexity Environment Health Resilience Society Urban World

MOOC – Healthy Urban Systems Part II

The MOOC – Healthy Urban Systems Part II

is now available on Coursera!

You will learn to:

  • Address urban health through complex multidisciplinary approaches
  • Use multidimensional and multiscale concepts, methods, and ecosystem frameworks
  • Mobilize and support all players directly or indirectly involved in urban health.

Dedicated to all levels of disciplines linked to the city, health, the environment, social and human sciences, data sciences…

The MOOC is entirely in English, with possible subtitles in French and Chinese.

The part II is dedicated to Theories and models

Module 3: Theoretical frameworks

  • Theories
    • Frameworks, theories, and models in relation with the fundamental concepts
    • Complex systems, Urban metabolism, Urban Ecology, Eco-system
    • Transition and resilience
  • Applications
    • Scaling effects in cities
    • Cognitive processes: Dissonance and mismatch
    • Participatory approaches
    • Collective and systems intelligence

Module 4 : Tools for modeling

  • Systems Modeling
    • Different Methods of Modelling (SD Simulation, Agent based, holistic system modeling) / individual – aggregated.
    • Modelling an epidemic: Agent Based modelling vs system dynamics.
  •  Implementation of concrete projects
    • AIRQ+ for outdoor Air Quality
    • CHEST for Household air quality
    • HEAT Model
    • Eco-policy© model
  •  Holistic Systems Modeling©

Materials: videos, glossary, quizzes, exercises, discussion forum

Duration: 4 weeks – 1 session per week to be taken at your convenience

Workload: 2 to 3 hours per week

Accreditation (possible and not compulsory): 2 ECTS for PART II, issued by the University of Lausanne via COURSERA (US$ 25)

General coordination:

University of Lausanne – UNIL-EPFL Foundation for Continuing Education

Prof. Céline Rozenblat, Jeff van de Poel

Don’t miss this extraordinary opportunity, for more information click on the link below:

Healthy Urban Systems course

Categories
Artificial Intelligence Cities Complexity Digital twins Geography Local digital twin MAPS Urban Vizualization

Digital twins for Amazon sustainability

Carlo Ratti, director of MIT’s Senseable City Lab, and Robert Muggah, co-founder of the Igarapé Institute, recently argued in a Mongabay op-ed how digital twins could support policies to protect and conserve the Amazon while improving people’s well-being by encouraging them to expand green bio-economic activities.

They pointed out that digital maps can help understand the forest ecosystem in more detail than ever before. Using LIDAR and AI technologies, it may soon be possible not only to map and digitalize each individual tree from crown to root, but also to understand and scan how different species are connected to the surrounding topography and how each part of the ecosystem relates to the land around it – i.e. a complex approach-.

Digital twins can therefore help to clarify the relationships between rainforest ecosystems and the cities embedded within them. This includes complex and informal neighborhoods that remain unmapped. Based on this new amount of data and knowledge about the Amazon rainforest, it could be possible to help protect the ecosystem from environmental crime and unsustainable development by promoting and encouraging green alternatives.

Follow this link to read the full article:

https://news.mongabay.com/2023/11/can-digital-twins-help-save-the-amazon-commentary/

If you are interested in the activities of MIT’s Senseable City Lab, follow this link:

https://senseable.mit.edu/

And for the Igarapé Institute:

https://shorturl.at/FMO26


Image source: MIT Senseable City Lab.

Categories
Cities Health Resilience SCIENCE Society Urban

MOOC – Healthy Urban Systems

We invite you to the Massive Open Online Course (MOOC) Healthy Urban Systems, designed specifically for professionals and enthusiasts in the field of urban health. This first part of the MOOC series (consisting of 3 MOOCs) will take you on a comprehensive 4-week journey, navigating through multidisciplinary frameworks and analytical observations critical to understanding the complexities of urban health.

You will learn to:

  • Address urban health through complex multidisciplinary approaches.
  • Use multidimensional and multiscale concepts, methods, and ecosystem frameworks.
  • Mobilize and support all players directly or indirectly involved in urban health.
  • Dedicated to all levels of disciplines linked to the city, health, the environment, social and human sciences, data sciences…

The MOOC is entirely in English, with possible subtitles in French and Chinese.

Materials: videos, glossary, quizzes, exercises, discussion forum.

Duration: 4 weeks – 1 session per week to be taken at your convenience.

Workload: 2 to 3 hours per week.

Accreditation (possible and not compulsory): 2 ECTS for PART I, issued by the University of Lausanne.

General coordination:

University of Lausanne – UNIL-EPFL Foundation for Continuing Education

Prof. Céline Rozenblat, Jeff van de Poel

Categories
Cities Complexity Economy Geography Networks Programming SCIENCE Simulation Vizualization

Cities in the face of green technologies, skills and preferences transitions – ECTQG 2023

At the European Colloquium of Theoretical and Quantitative Geography 2023 (ECTQG, 2023), Jorge Salgado – researcher at Citadyne – presented the progress of his research entitled: “Cities in the face of green technologies, skills and preferences transitions: a multilevel complex approach”. His agent-based modelling approach allows the simulation of changes in firms technologies and consumer preferences as a result of the green transition. The research has been well received because it simultaneously integrates key elements of the economic system, enabling bottom-up interactions to understand the reconfiguration of urban systems around the world.

If you are interested in this research you can contact Jorge Salgado: 

jorge.salgado@unil.ch

Categories
Cities Programming SCIENCE Simulation Urban Vizualization

A model-based spatio-temporal classification of global urban expansion  – ECTQG 2023

Dr Jingyan Yu, – postdoctoral researcher and member of Citadyne – presented the first results of her research “A model-based spatio-temporal classification of global urban” at the European Colloquium of Theoretical and Quantitative Geography 2023 (ECTQG, 2023).  She has developed static and dynamic measures to simulate urban expansion in Functional Urban Areas (FUA) around the world. She has found a global trend of physical spatial dispersion, producing discontinuous, dispersed built-up areas.

If you are interested in this research you can contact Dr Yu:

jingyan.yu@unil.ch

Categories
Artificial Intelligence Cities Complexity Urban

Urban AI: The Think Tank

Urban AI’s Thing Tank is a platform that promotes the use of artificial intelligence technologies to make cities smarter, based on six principles for urbanized technologies (i.e. technologies that promote urbanity and “cityness”): situated, open, decentralized, frictionless, meaningful and ecological. The think tank is based in Paris and was founded in 2021 by Hubert Beroche, who explored 12 cities and met more than 130 AI researchers to understand how AI is transforming and will transform cities. 

The core aspects of the think tank have been presented in the URBAN AI report, co-authored by 20 contributors who answer the same question: how will Urban AI transform our cities? According to Beroche, the aim was to create and develop the concept of “Urban AI” by discussing the different aspects of this technology and reflecting on its implications. The report can be downloaded from the following link:

https://urbanai.fr/our-works/urban-ai-report/

To date, the think tank has experienced significant growth, supporting more than 150 members. It has also produced several reports (e.g. The Future of Urban AI: Global Dialogues on Urban Artificial Intelligence, Geopolitics of Smart Cities: Expression of Soft Power and New Order, What goes into urban AI?). To learn more about Urban AI’s Thing Tank, please visit their website at:

https://urbanai.fr

Categories
Cities Complexity Digital twins Geography

The role of complexity for digital twins of cities

Caldarelli et al. (2023) published this month in Nature Computational Science:  “The role of complexity for digital twins of cities”. They argue that complexity science has the potential to integrate and support digital twins of cities. The huge amount of data produced by digital twins requires a theoretical and methodological background that can cope with the multiple and simultaneous interactions that occur in cities.

According to the authors, complexity could address these issues by combining data-based and hypothesis-based approaches. They also argue that twin cities need to face ethical norms and quality standards, for which “the concept of a digital twin needs to be extended to the social and environmental domain in a value-sensitive way, respecting privacy and human rights”. 

To access the publication, please follow this link:

https://shorturl.at/flmJK

Categories
Books Cities Complexity Local digital twin Metaverse Simulation

Smart Metaverse City – Digital twins cities

Smart Metaverse City – Digital twins cities

According to Charitonidou (2022), digital twins are virtual replicas of cities that are used to simulate environments and develop scenarios to address policy issues related to urban planning (e.g., sustainability, climate change, transport, etc.). Recently, Xu et al. (2023) published the chapter “Toward a Smart Metaverse City: Immersive Realism and 3D Visualization of Digital Twin Cities” in “Advances in Scalable and Intelligent Geospatial Analytics” (Durbha et al., 2023). The publication presents a conceptual prototype that combines the unique advantage of metaverse technology with the two-way connectivity of a digital twin city application.

This combination offers the possibility to create a virtual environment for immersive geovisualization that provides the opportunity to understand the complex urban system through science-based and data-driven approaches. The proposal and its real-world applications are discussed based on a twin city developed at Oak Ridge National Laboratory to facilitate participatory, smart and sustainable campus management.

More about this publication could be find in the following link:

https://shorturl.at/bxCDX

If you are interested in the Oak Ridge National Laboratory initiatives, you could follow this link: 

https://www.ornl.gov/

Image:World Economic Forum

References:

Charitonidou M.  (2022). Urban scale digital twins in data-driven society: Challenging digital universalism in urban planning decision-making. International Journal of Architectural Computing. 2022;20(2):238-253. doi:10.1177/14780771211070005

Durbha, S.S., Sanyal, J., Yang, L., S Chaudhari, S., Bhangale, U., Bharambe, U., & Kurte, K. (Eds.). (2023). Advances in Scalable and Intelligent Geospatial Analytics: Challenges and Applications (1st ed.). CRC Press. https://doi.org/10.1201/9781003270928

Categories
Books Cities Communication Economy Graph analysis History MAPS Misc Networks Resilience SCIENCE Social network Social science Society Vizualization World

Handbook on cities and networks

Edited by Zachary P. Neal, Associate Professor, Department of Psychology, Michigan State University, US and Céline Rozenblat, Professor of Urban Geography, Faculty of Geosciences and Environment,Université de Lausanne, Switzerland

Publication Date: 2021 ISBN: 978 1 78811 470 7 Extent: 672 pp

If you want to understand cities – the innovation and dynamism they generate and the way they sort and segregate people by class, race and other dimensions – you have to start by understanding that cities are networks. Zachary Neal and Céline Rozenblat have done all of us who care about cities a great service by pulling together the very best and brightest thinkers on cities and networks in this terrific volume.
– Richard Florida, University of Toronto, US and author of The Rise of the Creative Class and The New Urban Crisis

This Handbook of Cities and Networks provides a cutting-edge overview of research on how economic, social and transportation networks affect processes both in and between cities. Exploring the ways in which cities connect and intertwine, it offers a varied set of collaborations, highlighting different theoretical, historical and methodological perspectives.

International contributions assess the state of the field of network analysis, presenting interdisciplinary insights that draw on theory from geography, economics, sociology, history, archaeology and psychology, and outlining methodological tools that include ethnographic, qualitative and quantitative approaches. Illustrating a framework for integrating the diversity of urban networks, the Handbook demonstrates that by exploring urban networks with different combinations of levels and scales, new insights and opportunities can emerge.

Featuring focused studies on specific regions and cities, this state-of-the-art Handbook is essential reading for scholars and researchers of urban studies and regional science, particularly those focusing on the transformation of cities as connected spaces through intracity and intercity networks. Its core theoretical insights will also benefit graduate students in urban studies and network analysis.

Categories
Art Cities Resilience Vizualization

Resi-city: art, cities, resilience

Credits: resi-city.com

What is the meaning of a map? Is it an objective tool or a representation of values? “H. Mazurek invites us to compare the points of view of the geographer as opposed to the cartograph. The author argues that the first one should overcome a cartesian vision and engage in the construction of spaces where territoriality and human behavior are intrinsically linked. Through a critical approach of how maps should represent the true meaning of places and their historical scope, this publication reminds us that spaces are social constructions and indirectly questions the significance of humanitarian mapping. “

“The below “virtual” collage is inspired by PCdO Campos & I Paz study (12) on the mapping of Itaperuna, Rio de Janeiro, BR. In January 2020, the worst floods registered since 1932 impacted dramatically this urban area. The map itself shows the flood occurrence of the Muriae river during the event. The study used highly skilled techniques based on fractal analysis investigating the (lack of) drainage performance and its impact on flooding cartography usage. Confronting the absolute objectivity of sophisticated measurements to the inherent subjectivity of human behavior translates here into a deconstruction-reconstruction process of the mapping. Itaperuna looks fragmented in three parts, but together with the river and its redesigned flooding, they constitute an indissociable whole and an integral part of the social space. All around, silhouettes are talking, lying down, dancing or listening on a background of graffiti, a way to recall the challenge of pedagogy when teaching to non-expert citizens the meaning of urban resilience.”

More info here

Categories
Cities Communication MAPS Social science Society Vizualization

Data Journalism and the increasing mobilization of data in public debates

The Covid-19 pandemic has contributed to the daily use of graphics, dashboards and visualizations that helped make sense of its spread and global development. Data are increasingly available and easy to manipulate and diffuse. Big data inform business decisions and policy-making but they play an increasing role also in journalism, higher education and in public debates overall.

The European Journalism Center, supported by the Google News Initiative, have released their second Data Journalism Handbook , an open access e-book that inquires into the foundations, practices and actors of data journalism. The way data are incorporated in public debates is changing the way news are told to the public. Social scientists are also increasingly using big data in their researches, and for these to be relevant to society it is important to be able to disseminate results and communicate them properly. This is why this e-book might also be of interest for academics that wish to communicate and diffuse their research findings.

(Here below: an example from chapter 2 and an application to ethnic segregation in the USA)

Dot-density population map of race in the United States from census estimates, 2018. Source: The Washington Post. https://www.washingtonpost.com/graphics/2018/national/segregation-us-cities/


Categories
Cities Environment World

Is urbanization the solution to environmental crisis?

Increasing urbanization is a fact, with more than half of the world’s inhabitants living in cities. Cities are often perceived as a problem, but could they be the solution?

A thought-provoking article by Kim Stanley Robinson:

https://www.bloomberg.com/news/newsletters/2021-04-17/the-city-as-survival-mechanism

(Image by M.C. Escher: The tower of Babel)

Categories
Books Cities MAPS

Out now! Applying the Degree of Urbanisation — A methodological manual to define cities, towns and rural areas

The definition of cities and their limits is always a challenging task. In fact, urbanization patterns are very diverse and they rarely match administrative subdivisions. Thus, if it is often difficult to define where individual cities start and finish, it is even more so to compare cities across countries with very different history and urbanization patterns.

This manual has been produced by six organisations: the European Commission, the FAO, UN-Habitat, the ILO, the OECD and The World Bank. It develops a harmonized methodology to facilitate international statistical comparisons and to classify the entire territory of a country along an urban-rural continuum. The degree of urbanisation classification defines cities, towns and semi-dense areas, and rural areas.

Categories
Cities Economy Geography Vizualization

Making beautiful data visualizations with RawGraph

Are you interested in data visualization and you would like to experiment with different charts? Then you might give RawGraph a go. This web-based application lets you import your data, choose between different charts to visualize it, customize it and export it in svg format, ready to publish or further improve.

RawGraph is now available in a 2.0 beta version, but help pages include examples and tutorials for the previous one, so if any problems arise in the version 2.0 you might want to begin exploring the older 1.0 version.

Using RawGraph 1.0 we generated an explorative bumpchart showing the evolution in the number of multinational’s firms inter-urban linkages (logged on Y axis) of different Large Urban Regions from 2010 to 2019. London, New York, Paris and Tokyo are unsurprisingly at the top positions. On the other hand, the performance of Wilmington Delaware would be surprising if we didn’t know that it is one of the world’s leading tax havens and corporate friendly locations. Chinese cities such as Shanghai and Beijing also show sustained growth while Moscow sharply decreases its foreign linkages most likely because of the effects of international sanctions following the Ukraine war in 2014.

Categories
Cities Vizualization World

Readiness and response to Covid-19 crisis: how well have cities reacted?

The Covid-19 pandemic is highly affecting cities because population density favors virus diffusion. Cities are reinventing themselves in order to minimize chances of contagion while staying alive and functioning. A recently released UN-HABITAT platform evaluates how well cities have responded to and coped with the crisis, constituting an informative base for assessing containment efforts and designing upcoming urban policies.

“The web-based visual platform provides scoring for over 1,000 cities including, where data is available, cities with a population of 500,000 or higher along with country capitals and state/provincial capitals for the USA, Brazil, India, and China and allows for the addition of cities as data becomes available.

The COVID-19 Readiness and Responsiveness tracker for cities is a unique scoring mechanism that integrates a range of data points to provide a COVID-19 Readiness Score and a COVID-19 Responsiveness Score on a scale of 0-100.

The Readiness Score is based on five core indicator areas: public health capacity, societal strength, economic ability, infrastructure, and national collaborative will. Meanwhile the Responsiveness Score is based on: spread response, treatment response, economic response and supply chain response. The input data is normalized to provide comparison between cities.

The tracker, available at https://unhabitat.citiiq.com/ is powered by the CitiIQ platform which is capable of sourcing, translating and communicating both the Readiness and Responsiveness scores of cities.”

What do you think of this visualization tool? What dynamics does it help to illuminate? What other sources might be integrated into score measurement? Have a good exploration!

Categories
Cities Environment MAPS

The Million Neighborhoods initiative: mapping spatial inequalities within cities.

The Million Neighborhoods Map is a groundbreaking visual tool that provides the first comprehensive look at informal settlements across Africa, helping to identify communities most in need of roads, power, water, sanitation and other infrastructure. Updates for Central and South America, India and parts of Europe and Asia will come online in early 2020.

The Million Neighborhoods Map is the first such map of its kind and digitally renders building infrastructure and street networks – or the lack thereof. The goal is to provide municipal leaders and community residents with a tool to help inform and prioritize infrastructure projects in underserviced neighborhoods, including informal urban settlements that are sometimes known as “slums.”

View the map at https://millionneighborhoods.org.

The Million Neighborhoods initiative is a collaborative network of diverse organizations working locally in Chicago and in neighborhoods throughout the world towards more sustainable and equitable human development. The network builds a common framework, tools, and data for mapping, planning, and coordinating solutions towards fulfilling the UN’s Agenda 2030 for Global Sustainable Development.

For the science behind the map, check out:

Brelsford, C., Martin, T., Hand, J., Bettencourt, Luís M. A., Toward cities without slums: Topology and the spatial evolution of neighborhoods (August 29, 2018). Science Advances. Vol. 4, no. 8, eaar4644. https://doi.org/10.1126/sciadv.aar4644

Brelsford, C., Martin, T. Bettencourt, Luís M. A., Optimal reblocking as a practical tool for neighborhood development (June 12, 2017) Sage Journals. https://doi.org/10.1177/2399808317712715


Categories
Art Cities SCIENCE Society

When Holling meets Kandinsky: Panarchy, Resilience and Abstraction

“Identifying and managing risks is nowadays key in any strategic planning. Under the wording risk management, companies aim to control and minimize the risk level that could impact their short or long-term profitability. In cities, risk management is expected to drive urban planning safety approach and better integrate hazards occurrence. It is based on procedural and systemic approaches, most of the time certified, built on conventional and analytical methodologies.

In a rapidly changing world where surprise is likely (1), the same descriptive approach applies on our environment threatened by natural hazards. Our fragility awareness reflects in greater consideration for human vulnerability, but the modus operandi to decrease the risk level is comparable, based on decision tree analysis and quantitative/qualitative frameworks. Amongst the first questionings on the relevance of such linear thinking, Holling’s “panarchy” (2) conceptual model introduced the idea that social and ecological systems are interlinked and continuously restructure and renew depending on their environment. By reconsidering the norms, introducing unpredictability as a random variable and conceptualizing risk management, the seeds of resilience had been sowed. On one hand, a normative approach; on the other, a critical thinking?”

Full post and a rich bibliography here.


Categories
Cities Environment Geography MAPS Vizualization

The Atlas of urban expansion- how do cities grow?

The Atlas of Urban Expansion collects and analyzes data on the quantity and quality of urban expansion in a stratified global sample of 200 cities. With the aid of satellite images researchers have gathered a rich dataset on built-up areas and the associated land use regulations and policies that sheds light on the process of expansion of urban peripheries since 1990. Besides, for a sample of 30 cities, researchers gathered historical data on urban expansion from 1800 to 2014 and used it to generate visually appealing animations that show intuitively the process of urban growth. See, for example, the animation of Los Angeles below.

The Atlas of Urban expansion is a joint initiative by NYU Urban Expansion Program, the Stern school of Business at NYU in partnership with UN-Habitat and the Lincoln Institute of Land Policy.

The Atlas can be freely downloaded, and a number of urban data, maps and metrics can be also downloaded.