Français
English
Géoblog
The popular science blog of the Faculty of Geosciences and the Environment
Research in action
Insight
The faculty’s “Insights” programme brings together researchers from a variety of disciplines, ranging from the humanities to the exact sciences.
Winners and projects
Theses defended
The dynamism of research is reflected in the numerous theses prepared and defended in the Faculty. Here you will find summaries of doctoral theses in geography, earth sciences, environmental sciences and tourism studies. Some of these works are available in full in Open Access on SERVAL.
Press review
Files
Events
Urban farming
« Rapid urban growth in the developing world is placing increasing strain on urban food supply systems. Agriculture, which includes horticulture, livestock raising, fisheries, forestry, and the production of milk and fodder, is expanding within and around cities. Urban agriculture provides fresh food, generates employment, recycles urban waste, creates green belts, and strengthens cities’ resilience to climate change. » — Food and Agriculture Organization of the United Nations
Regional planning
Anthropocene
Weather report
Refresh your knowledge of meteorology with the column by Jean-Michel Fallot, geographer, senior lecturer at the Institute of Geography and Sustainability, and climate specialist. Mr Fallot regularly provides a summary of the weather in Switzerland, climate and seasonal trends, and the history of meteorology in our country, based on data from MétéoSuisse.
Far north
Artificial intelligence
Oceans
Focus on best practices
How are field and research practices evolving in geosciences and environmental sciences? Discover the testimonials and reflections of our research community in this report.
Research at work
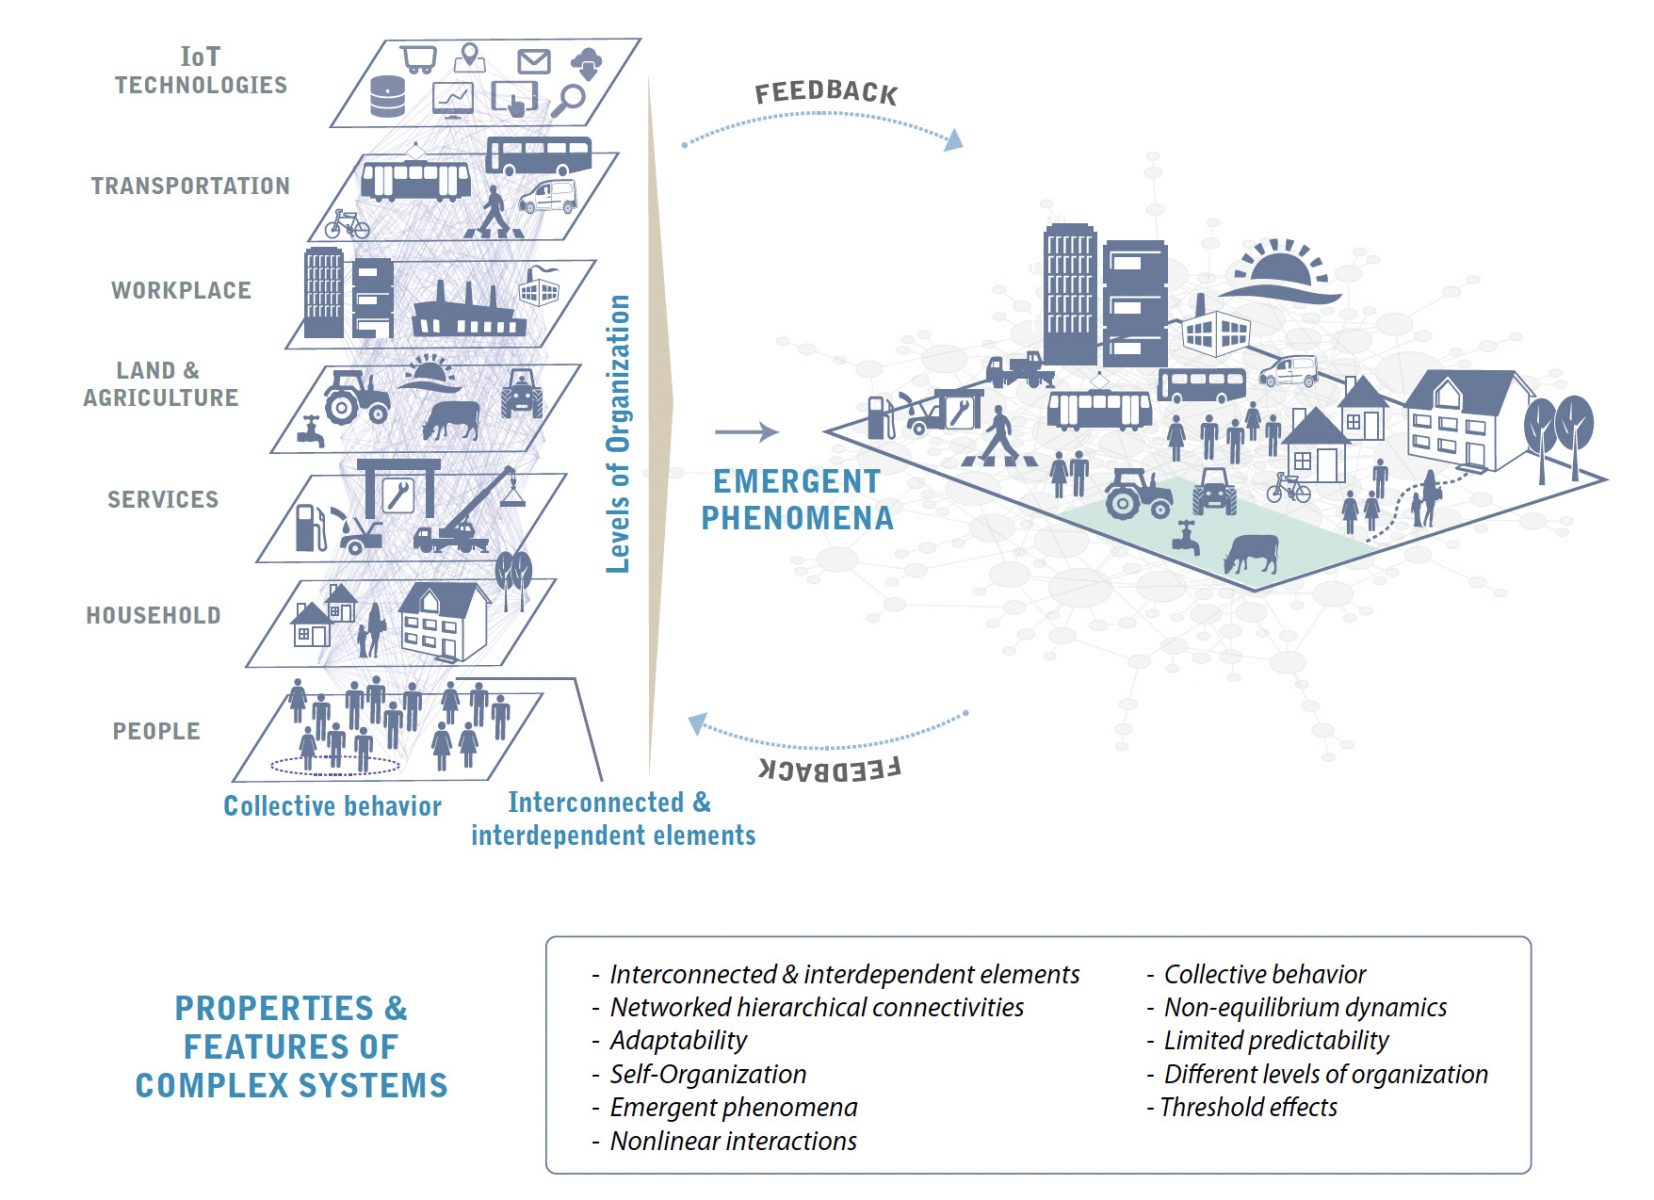
Digital Twin Cities : the need to integrate more complexity in the analysis
10 May 2023
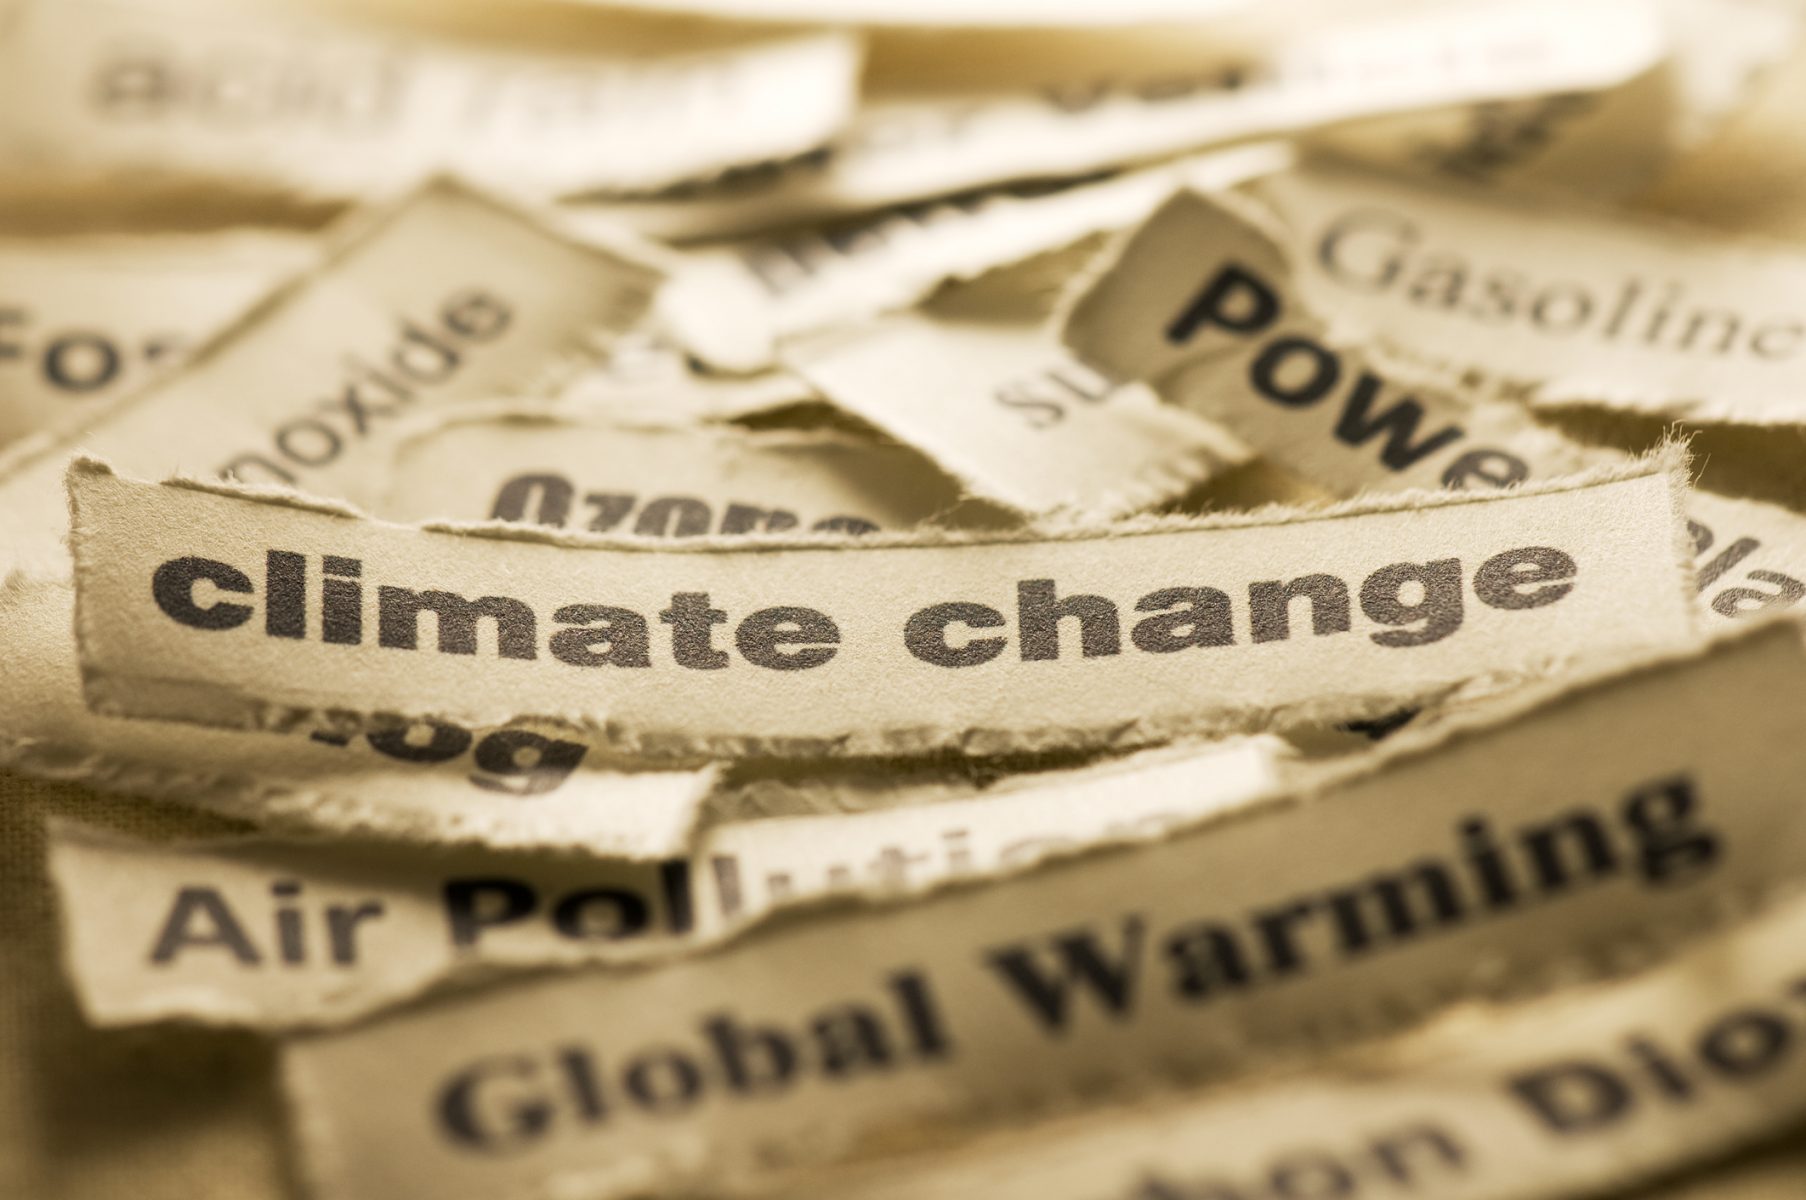
Media coverage of climate change research does not inspire action
19 April 2023
A roadmap for integrating species in biodiversity restoration
5 April 2023
Oxidation phenomena would have taken place much earlier than thought on Earth
27 March 2023
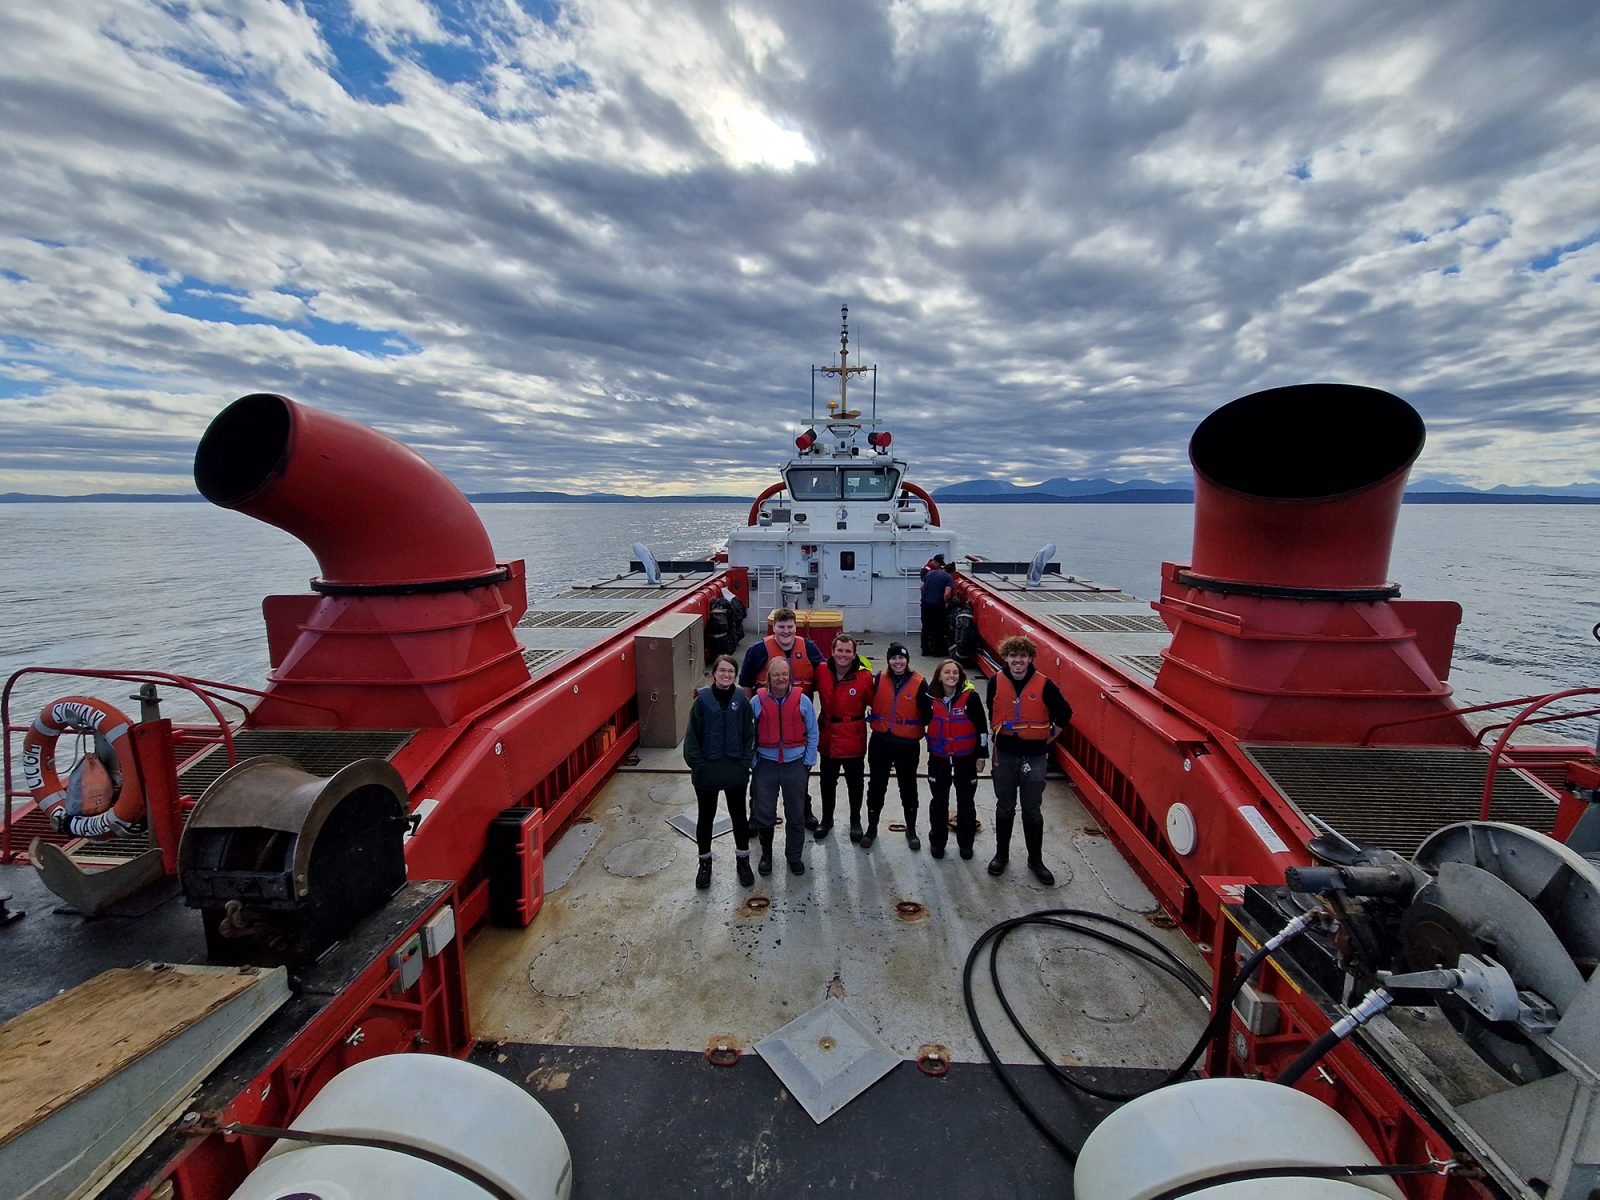
Sampling expedition off the coasts of Vancouver: first step to a better understanding of the cycle of chromium in the ocean
9 February 2023
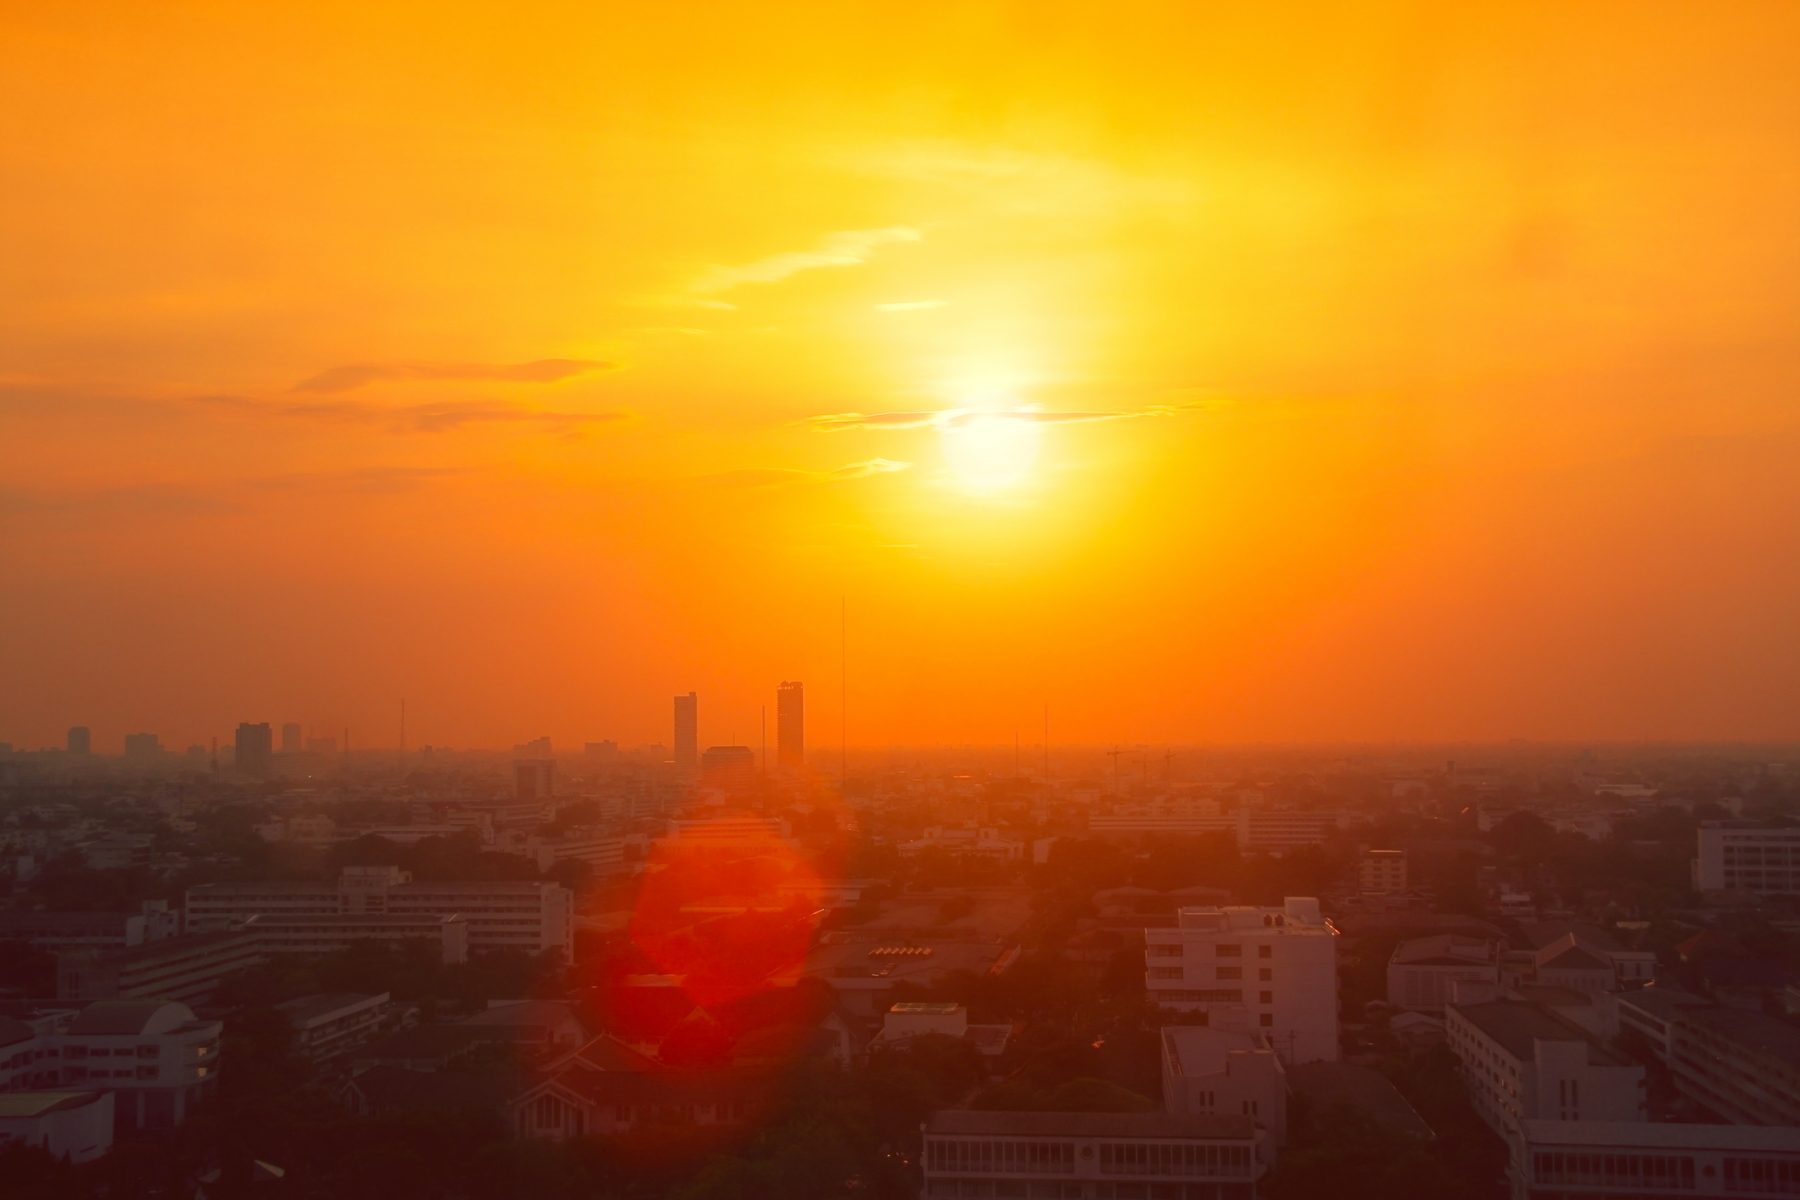
Better predicting heat waves, which affect all inhabited areas
19 December 2022
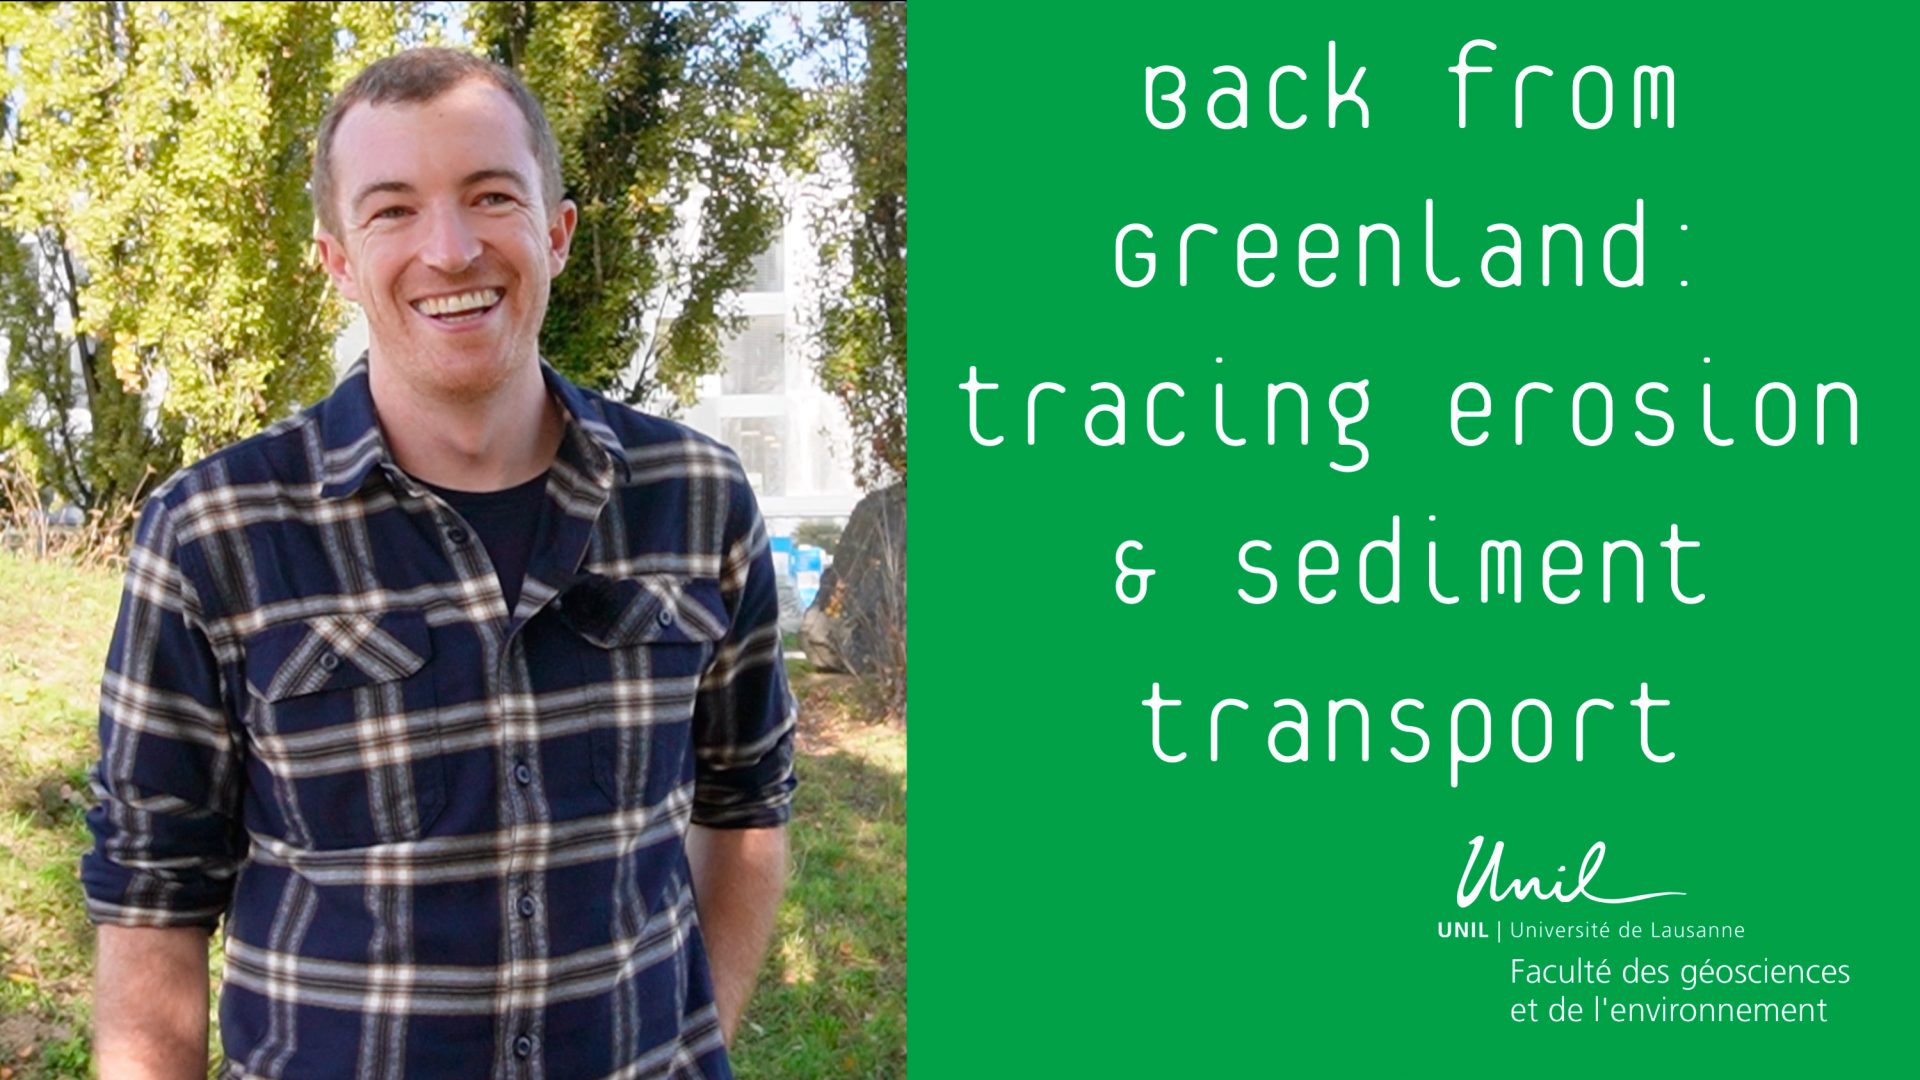
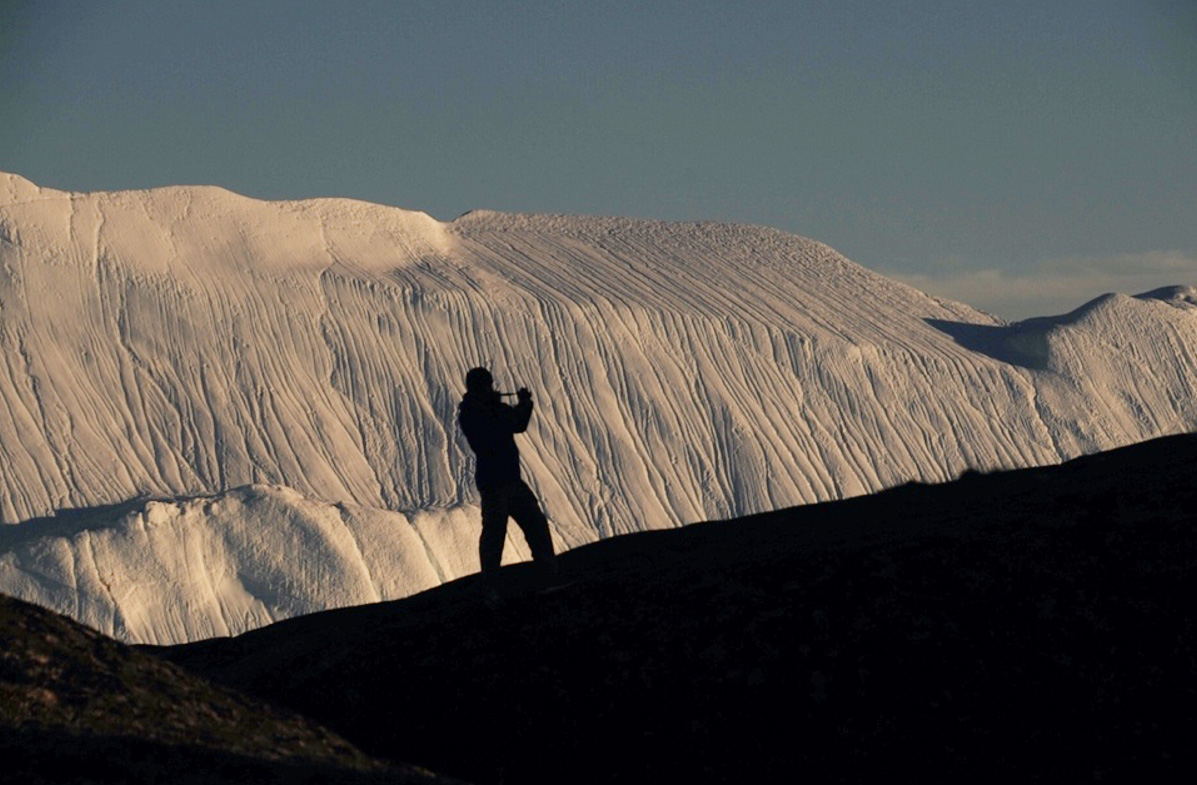
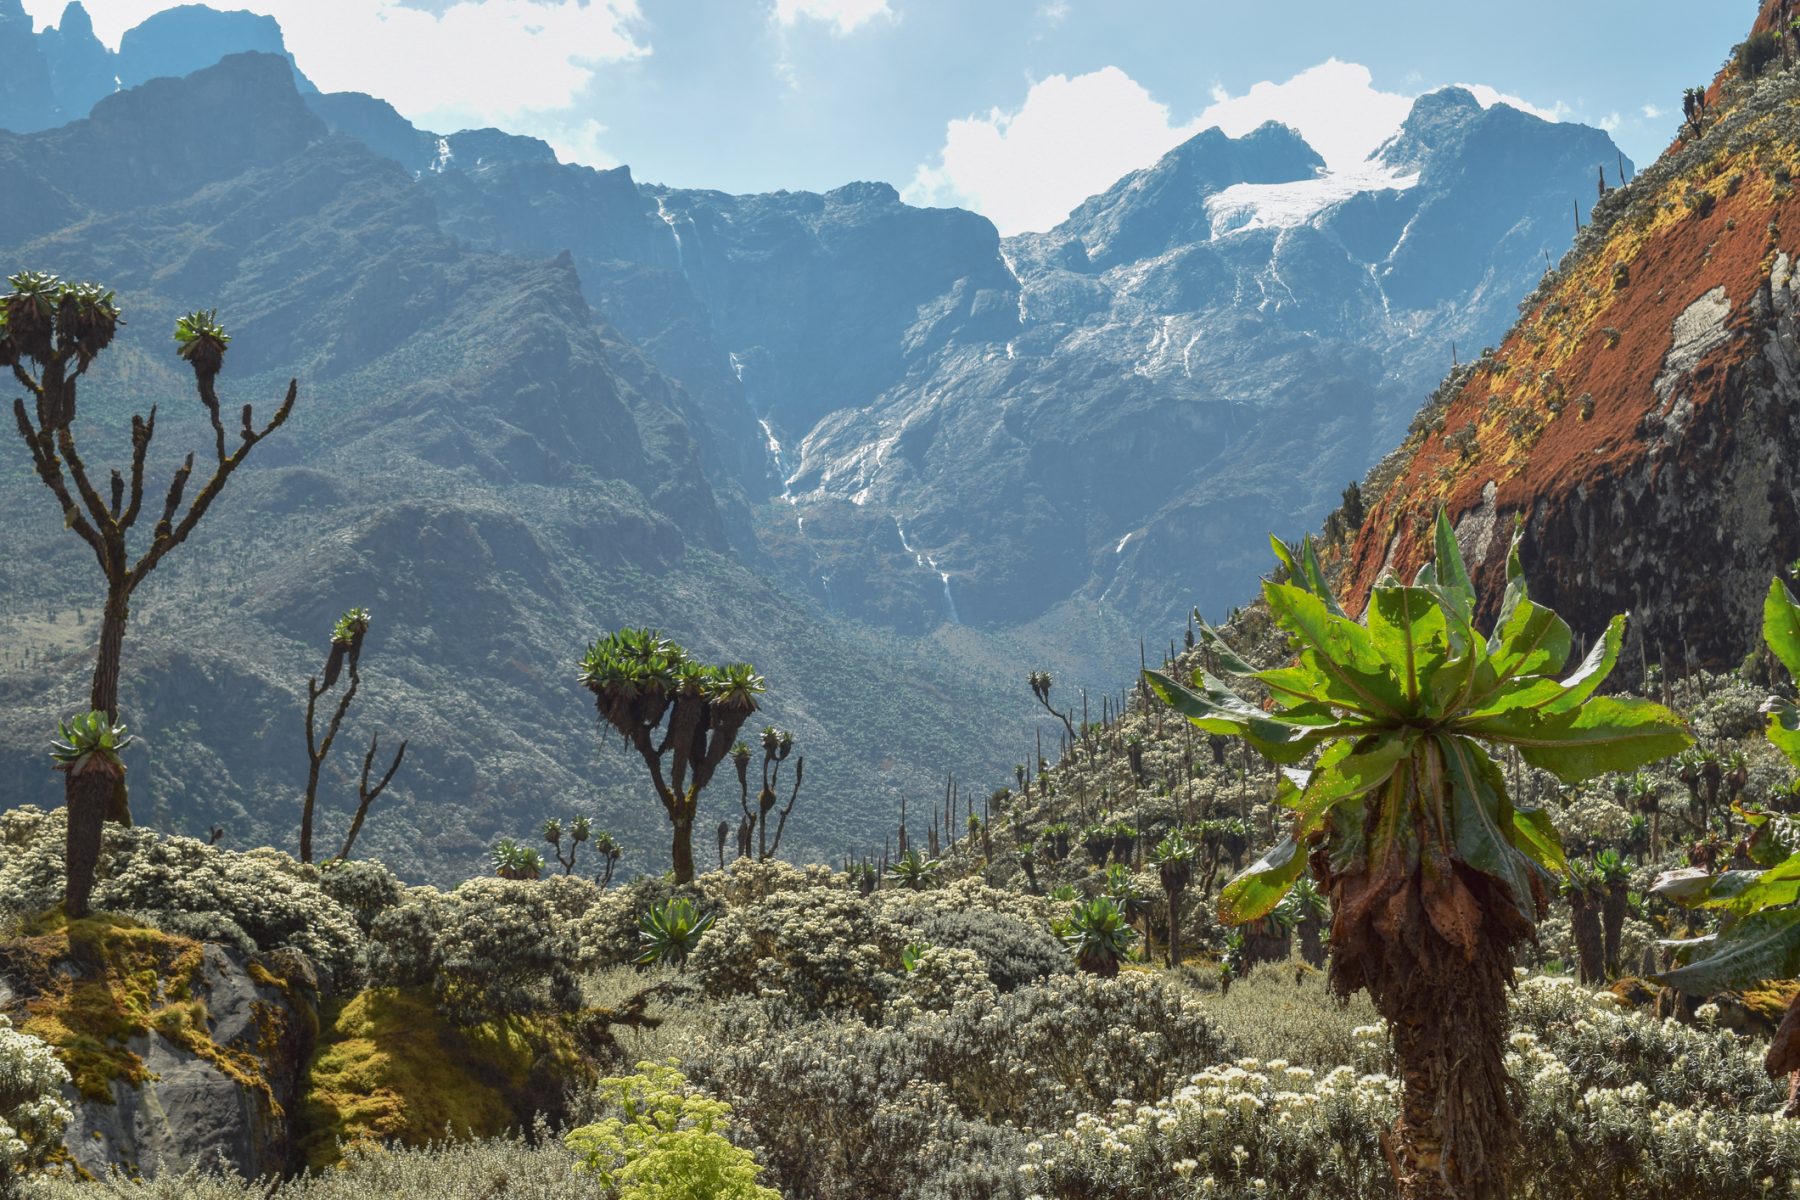
Back from Greenland: what sediments tell us about the retreat of the Ice Sheet
17 November 2022
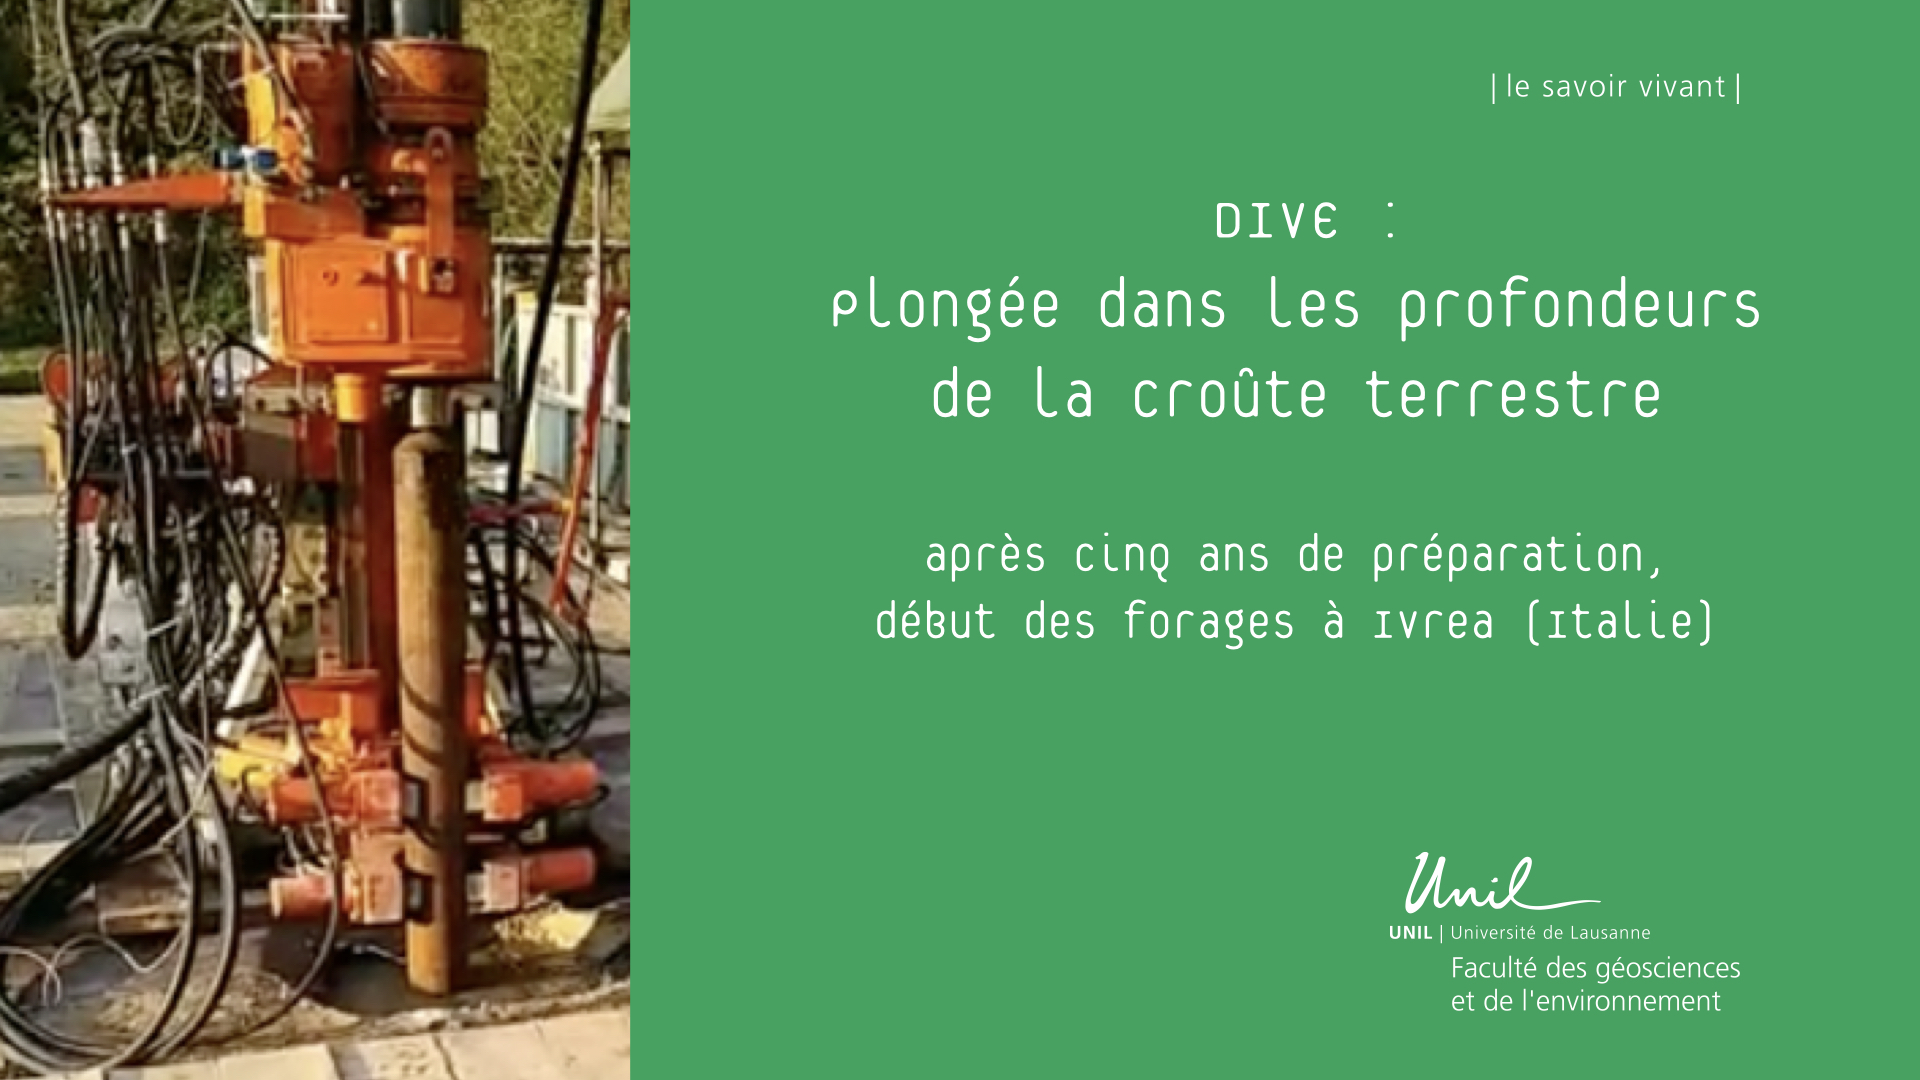
Reaching the Earth’s mantle: a dive into the depths of its continents
4 November 2022
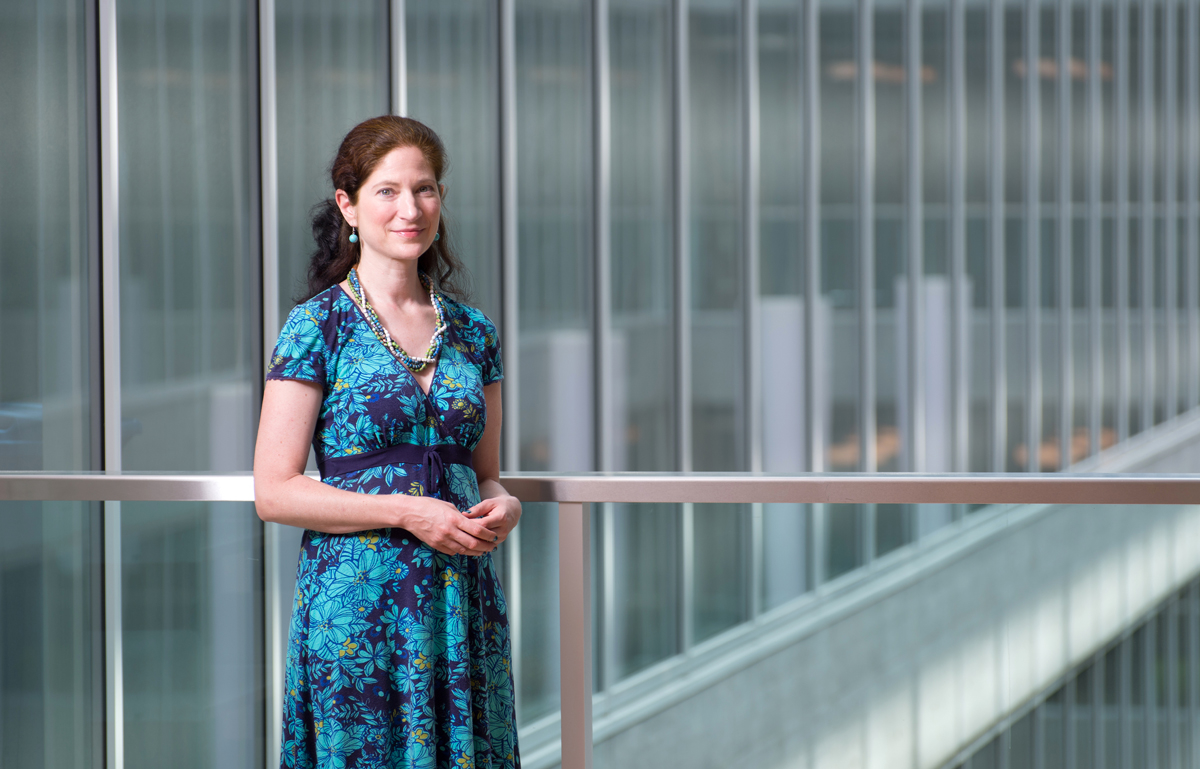
A shifting project of post-growth economics funded by an ERC Synergy in Spain and Switzerland
25 October 2022
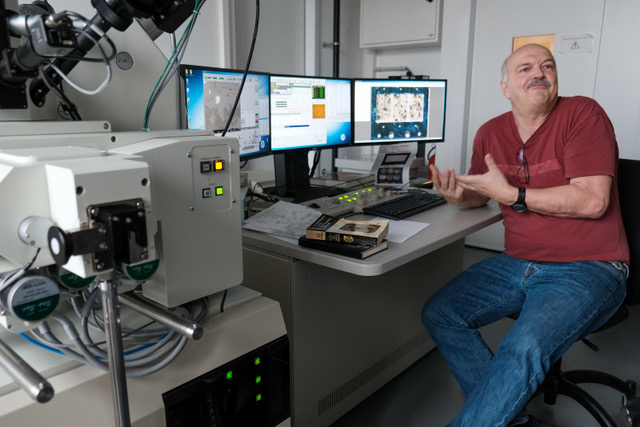
High pressure experiments: laboratory tour with Prof. Lukas Baumgartner
11 October 2022
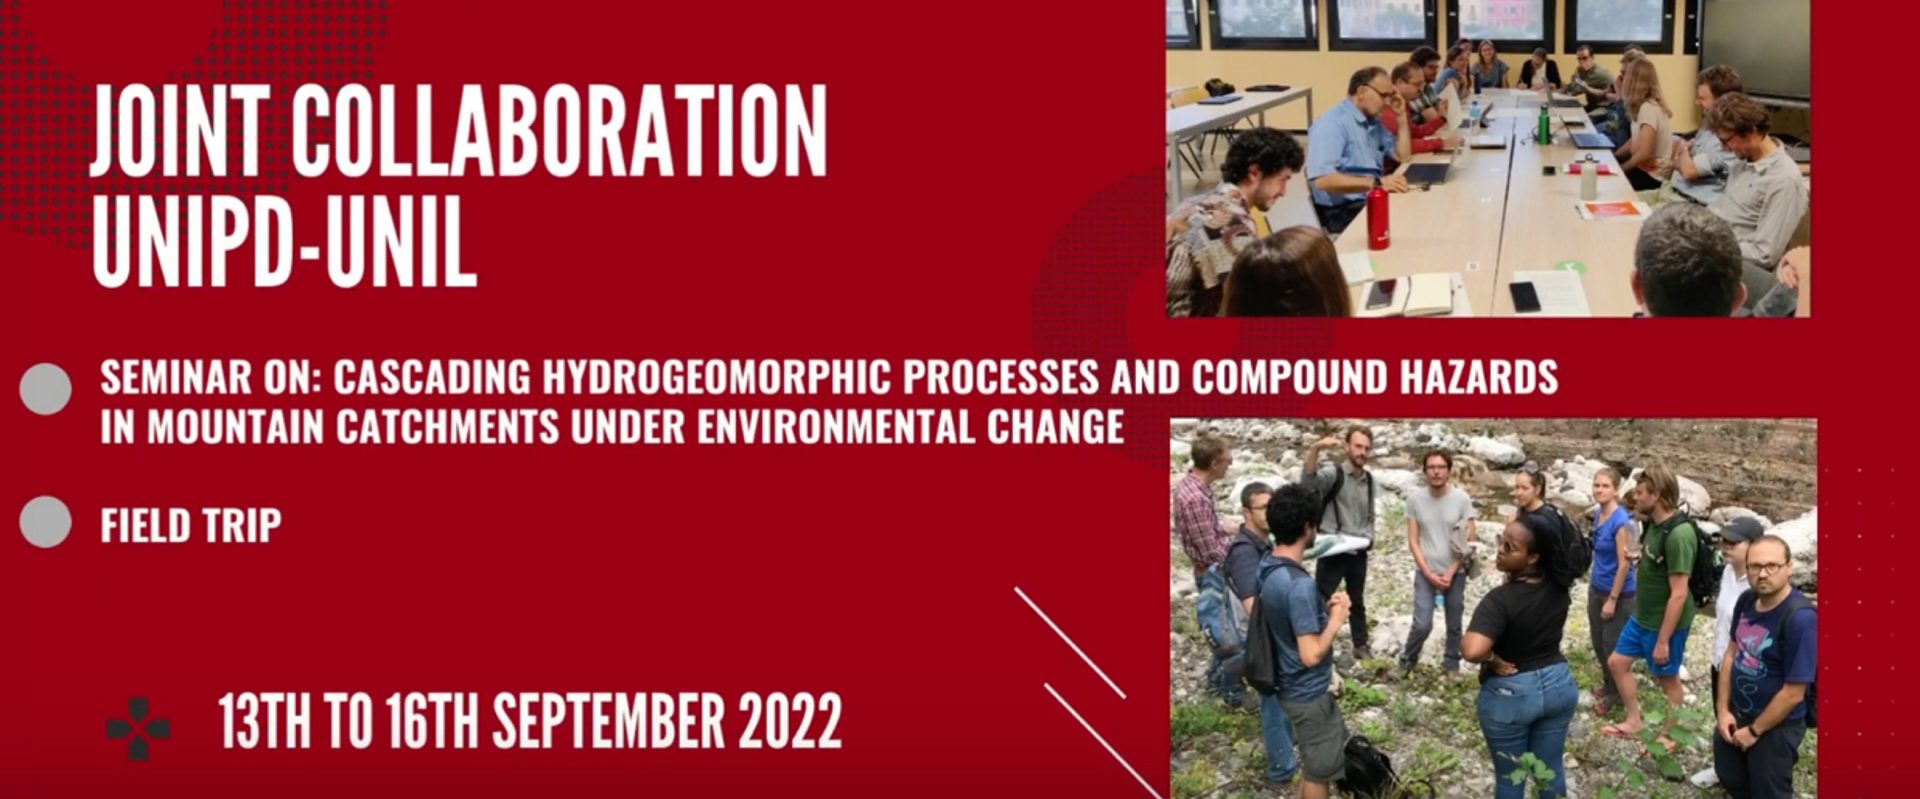
Cascade hydrogeomorphic hazards and risks : complex processes under the survey of an Italian-Swiss collaboration
6 October 2022
Climate: Past history deciphered for future projections
3 October 2022
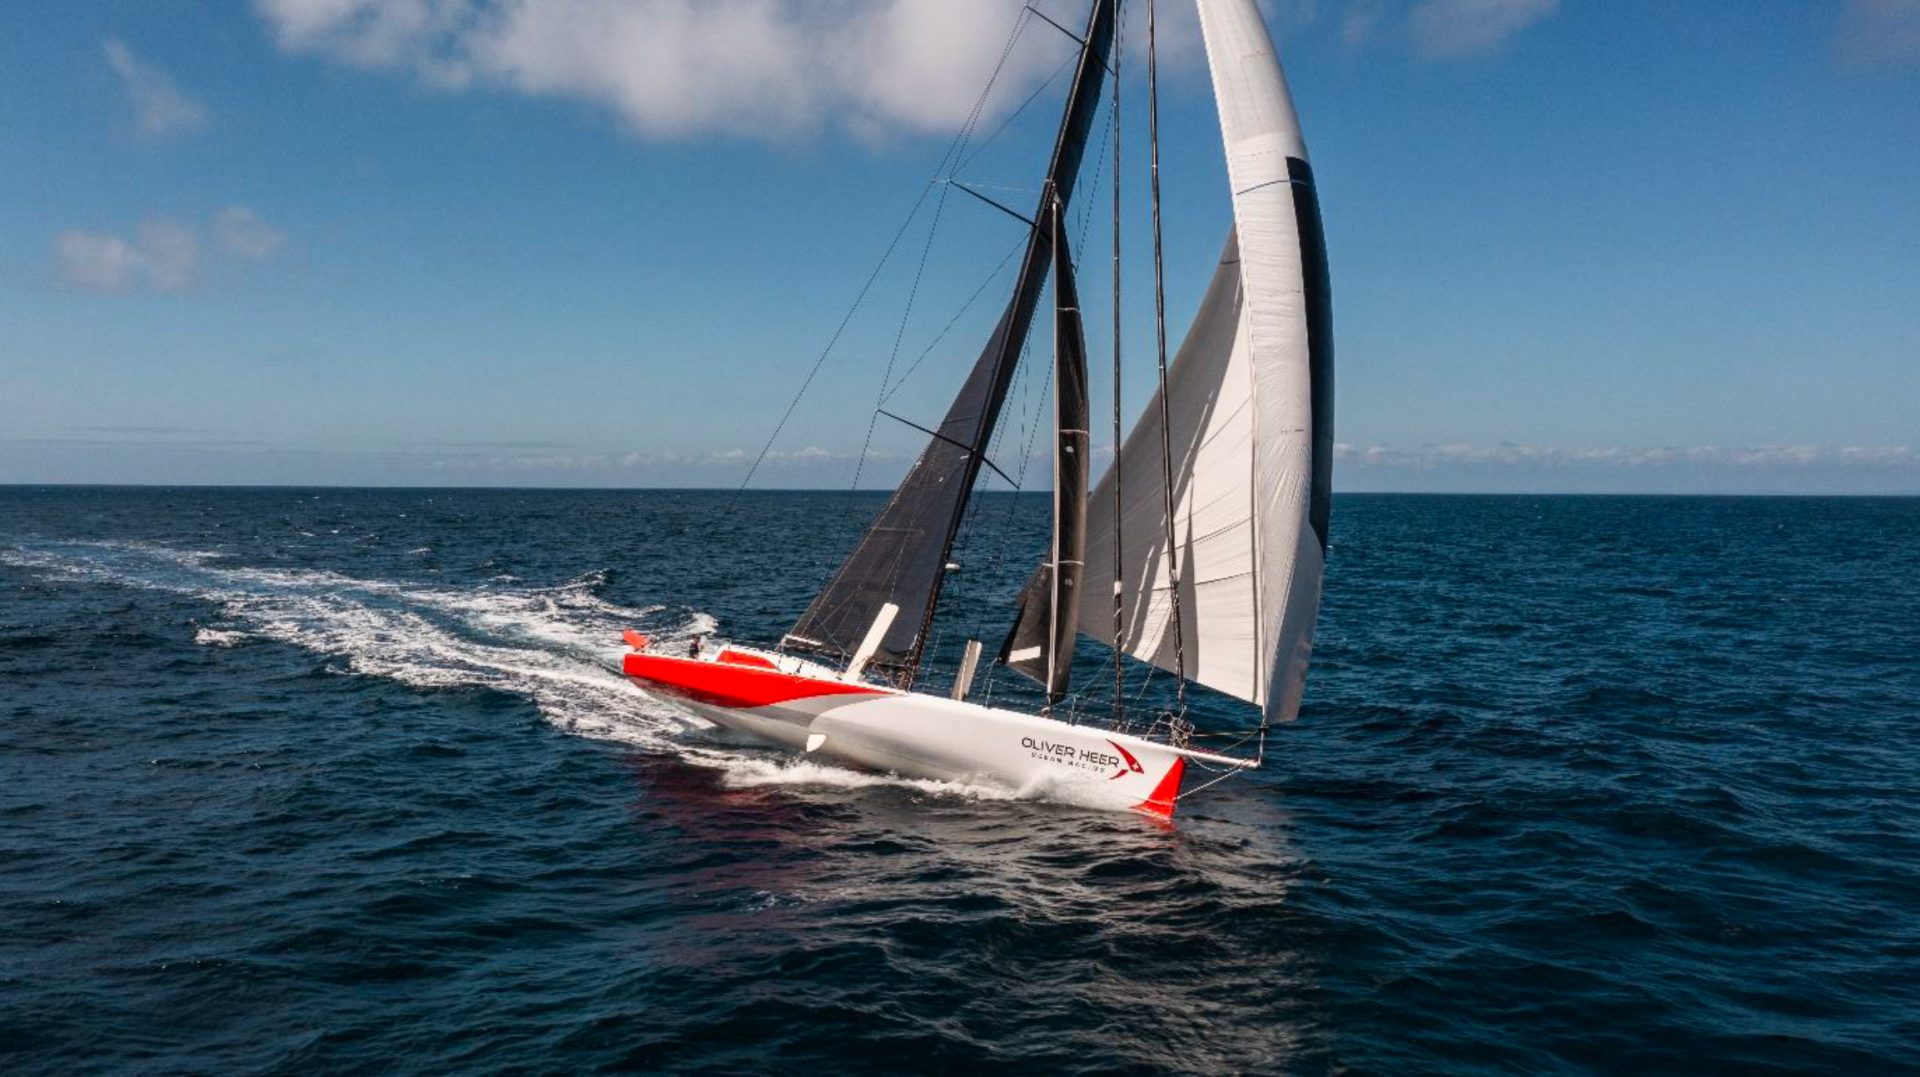
Science and Sailing to collect environmental data in understudied Ocean Regions
9 September 2022
How cold was it, 20,000 years ago?
6 July 2022
Solution travel in porous media: from microscopic flow to macroscopic transport
4 July 2022
←
Previous Page
1
2
3
4
5
6
Next Page
→