Categories
Cities Complexity Environment Health Resilience Society Urban World

MOOC – Healthy Urban Systems Part II

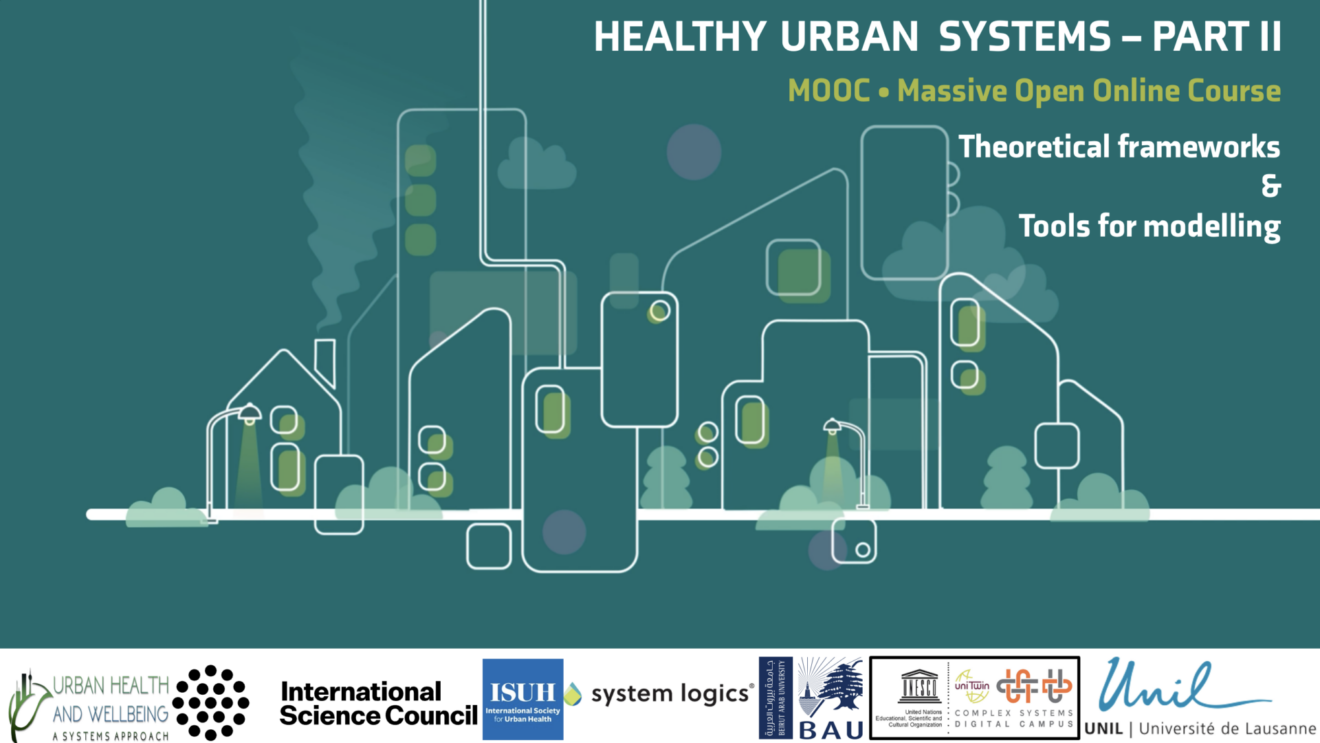
The MOOC – Healthy Urban Systems Part II

is now available on Coursera!

You will learn to:

  • Address urban health through complex multidisciplinary approaches
  • Use multidimensional and multiscale concepts, methods, and ecosystem frameworks
  • Mobilize and support all players directly or indirectly involved in urban health.

Dedicated to all levels of disciplines linked to the city, health, the environment, social and human sciences, data sciences…

The MOOC is entirely in English, with possible subtitles in French and Chinese.

The part II is dedicated to Theories and models

Module 3: Theoretical frameworks

  • Theories
    • Frameworks, theories, and models in relation with the fundamental concepts
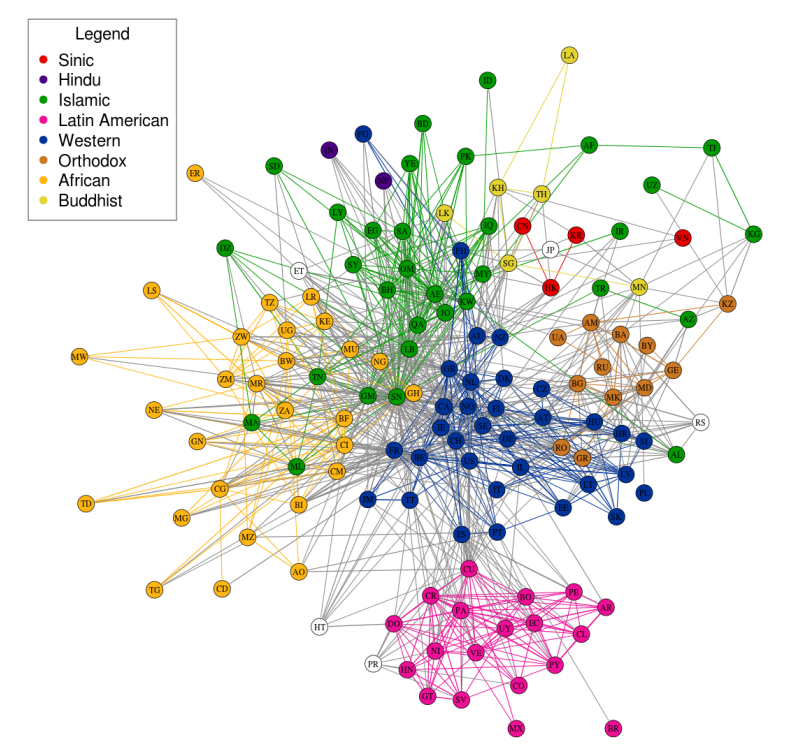
    • Complex systems, Urban metabolism, Urban Ecology, Eco-system
    • Transition and resilience
  • Applications
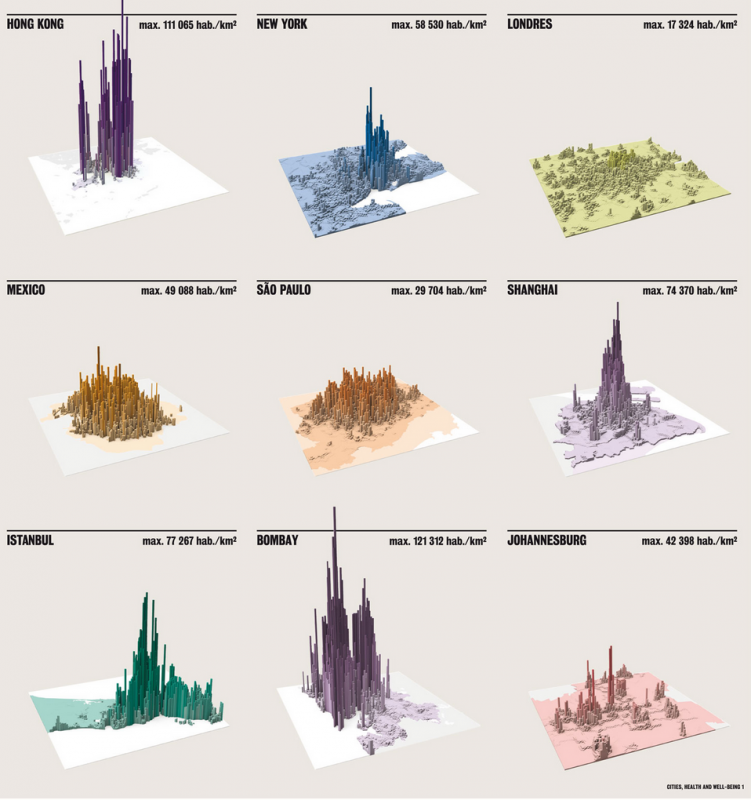
    • Scaling effects in cities
    • Cognitive processes: Dissonance and mismatch
    • Participatory approaches
    • Collective and systems intelligence

Module 4 : Tools for modeling

  • Systems Modeling
    • Different Methods of Modelling (SD Simulation, Agent based, holistic system modeling) / individual – aggregated.
    • Modelling an epidemic: Agent Based modelling vs system dynamics.
  •  Implementation of concrete projects
    • AIRQ+ for outdoor Air Quality
    • CHEST for Household air quality
    • HEAT Model
    • Eco-policy© model
  •  Holistic Systems Modeling©

Materials: videos, glossary, quizzes, exercises, discussion forum

Duration: 4 weeks – 1 session per week to be taken at your convenience

Workload: 2 to 3 hours per week

Accreditation (possible and not compulsory): 2 ECTS for PART II, issued by the University of Lausanne via COURSERA (US$ 25)

General coordination:

University of Lausanne – UNIL-EPFL Foundation for Continuing Education

Prof. Céline Rozenblat, Jeff van de Poel

Don’t miss this extraordinary opportunity, for more information click on the link below:

Healthy Urban Systems course

Categories
MAPS Networks Vizualization World

Measuring power relations in Asia

The annual Asia Power Index — launched by the Lowy Institute in 2018 — measures resources and influence to rank the relative power of states in Asia. The project evaluates international power in Asia through 128 indicators across eight thematic measures: military capability and defence networks, economic capability and relationships, diplomatic and cultural influence, as well as resilience and future resources.

The Index ranks 26 countries and territories in terms of their capacity to shape their external environment — its scope reaching as far west as Pakistan, as far north as Russia, and as far into the Pacific as Australia, New Zealand and the United States.

The project allows to choose different types of visualizations, and one of the most interesting among them is the network visualization that shows how countries are connected through their economic, cultural, defence and diplomatic ties.

Categories
Environment Geography MAPS SCIENCE Vizualization World

The interactive atlas of climate change

The IPCC has recently published their sixth assessment report on the physical evidence of climate change. The report has again confirmed evidence of climate change across all global regions, which will affect rainfall patterns, sea levels, exposure to extreme heat events. To better understand the impact of these changes across regions, the Working Group I has produced an interactive Atlas that allows to visualize the geographical impact of different climate change scenarios. Climate change is here, and it is crucial to comprehend its varying geographical impact, so this is a very welcome tool to help researchers and policy makers in this task.

Categories
Books Cities Communication Economy Graph analysis History MAPS Misc Networks Resilience SCIENCE Social network Social science Society Vizualization World

Handbook on cities and networks

Edited by Zachary P. Neal, Associate Professor, Department of Psychology, Michigan State University, US and Céline Rozenblat, Professor of Urban Geography, Faculty of Geosciences and Environment,Université de Lausanne, Switzerland

Publication Date: 2021 ISBN: 978 1 78811 470 7 Extent: 672 pp

If you want to understand cities – the innovation and dynamism they generate and the way they sort and segregate people by class, race and other dimensions – you have to start by understanding that cities are networks. Zachary Neal and Céline Rozenblat have done all of us who care about cities a great service by pulling together the very best and brightest thinkers on cities and networks in this terrific volume.
– Richard Florida, University of Toronto, US and author of The Rise of the Creative Class and The New Urban Crisis

This Handbook of Cities and Networks provides a cutting-edge overview of research on how economic, social and transportation networks affect processes both in and between cities. Exploring the ways in which cities connect and intertwine, it offers a varied set of collaborations, highlighting different theoretical, historical and methodological perspectives.

International contributions assess the state of the field of network analysis, presenting interdisciplinary insights that draw on theory from geography, economics, sociology, history, archaeology and psychology, and outlining methodological tools that include ethnographic, qualitative and quantitative approaches. Illustrating a framework for integrating the diversity of urban networks, the Handbook demonstrates that by exploring urban networks with different combinations of levels and scales, new insights and opportunities can emerge.

Featuring focused studies on specific regions and cities, this state-of-the-art Handbook is essential reading for scholars and researchers of urban studies and regional science, particularly those focusing on the transformation of cities as connected spaces through intracity and intercity networks. Its core theoretical insights will also benefit graduate students in urban studies and network analysis.

Categories
Cities Environment World

Is urbanization the solution to environmental crisis?

Increasing urbanization is a fact, with more than half of the world’s inhabitants living in cities. Cities are often perceived as a problem, but could they be the solution?

A thought-provoking article by Kim Stanley Robinson:

https://www.bloomberg.com/news/newsletters/2021-04-17/the-city-as-survival-mechanism

(Image by M.C. Escher: The tower of Babel)

Categories
Geography Society Vizualization World

The Atlas of Sustainable Development Goals: where do we stand?

The Atlas of Sustainable Development Goals 2020 presents interactive storytelling and data visualizations about the 17 Sustainable Development Goals. It highlights trends for selected targets within each goal and introduces concepts about how some SDGs are measured. Where data is available, it also highlights the emerging impact of the COVID-19 pandemic on the SDGs.

The Atlas draws from the World Bank’s World Development Indicators database, as well as from a wide variety of relevant data sources from scientists and other researchers worldwide.


Categories
Mobility Networks SCIENCE Society World

À contresens- the wrong way- Are electric cars not so green?

Electric cars are increasingly regarded as an interesting option to lower greenhouse emissions and curb pollution, especially in cities. There is often criticism, however, around a number of critical issues that would make electric vehicles not such a “green” option.

1- Some critics say that electric cars contain a number of rare earth metals whose extraction and processing are intensive in terms of energy demanded and use of chemicals. Furthermore, rare earth elements are mostly provided by China, making it a sensitive geopolitical topic. Other main ingredients in the electric car recipe include lithium, and cobalt, whose extraction also give concerns in terms of their environmental and social impact.

2- Related to the previous point, some critics say that batteries – the main component of electric cars- is not recycled and therefore we would be contributing to generating a large volume of polluting high tech wastes.

3- Where does the electricity for recharging electric cars come from? In countries that still rely on fossil fuels (such as Germany with coal) an important question is wether it is really a greener option to use electricity instead of gasoline?

A Swiss documentary addresses the way these topics are being framed by media and in the public opinion. What they found is that these criticisms are largely unwarranted or at least exaggerated. The team fully dismantled an electric car along with a conventional one, and found no traces of rare earth in the electric ones while they did find them in the catalyzer of the fuel one. Besides, they went to Congo to find that accusations of child labour in cobalt mines are only a marginal part of the story, whereas in Chile they discovered that Lithium production is not so polluting as portrayed. Eventually, the documentary makes the viewer ask the question of: why do I know what I know? Why do conventional and social media give so much attention to negative stories in order to throw bad light on electric cars without questioning conventional ones?

You can watch their trailer below (french only for the moment), and you can find here a list of their sources.


Categories
Europe Geography Graph analysis Networks Social network Vizualization World

Navigating the supply chain network of strategic resources

The European Union has recently acknowledged the strategic role of a number of critical raw materials that are used in the ICT, energy and defense industry. As a result, the Joint Research Center of the European Commission has set up a Raw Materials Information Center that collects legal, economic, trade and policy data on strategic raw materials. A particularly interesting tool is the Supply Chain Viewer, that allows to visualize the global production network of a number of raw materials along with the countries of production and the sectors in which they are employed.

“The raw materials Supply Chain Viewer (SCV) provides an overview of networks of selected raw materials supply chains, consisting of supplying countries, material products, product applications, and economic sectors using such products and materials.

Conceptually, this type of data representation is forming a directed graph, i.e. a network consisting of nodes or vertices (four different types, namely countries, materials, applications and sectors) connected together. These connections (named either links or edges) are representing the flows associated to a specific material. More precisely, in technical terms, this is referred to as an acyclicconnected and oriented graph, i.e. a directed graph without multiple/symmetric edges or loops.[5]

Data for the linkages among countries, materials, product applications and sectors were selected mainly from the EC criticality assessment (CRM 2017)[1]. Such underlying data refer to the period 2010-2014. For several cases, where data were not reported in the CRM 2017, missing data were collected from BGS[3] or Eurostat[4]. On each link, a detailing popup displays the data source. In the SCV graph, data is comprised in the connecting links and not in the nodes, these being simply connecting points in the network[2].”

For more information, you can visit the project page.

Categories
Cities Vizualization World

Readiness and response to Covid-19 crisis: how well have cities reacted?

The Covid-19 pandemic is highly affecting cities because population density favors virus diffusion. Cities are reinventing themselves in order to minimize chances of contagion while staying alive and functioning. A recently released UN-HABITAT platform evaluates how well cities have responded to and coped with the crisis, constituting an informative base for assessing containment efforts and designing upcoming urban policies.

“The web-based visual platform provides scoring for over 1,000 cities including, where data is available, cities with a population of 500,000 or higher along with country capitals and state/provincial capitals for the USA, Brazil, India, and China and allows for the addition of cities as data becomes available.

The COVID-19 Readiness and Responsiveness tracker for cities is a unique scoring mechanism that integrates a range of data points to provide a COVID-19 Readiness Score and a COVID-19 Responsiveness Score on a scale of 0-100.

The Readiness Score is based on five core indicator areas: public health capacity, societal strength, economic ability, infrastructure, and national collaborative will. Meanwhile the Responsiveness Score is based on: spread response, treatment response, economic response and supply chain response. The input data is normalized to provide comparison between cities.

The tracker, available at https://unhabitat.citiiq.com/ is powered by the CitiIQ platform which is capable of sourcing, translating and communicating both the Readiness and Responsiveness scores of cities.”

What do you think of this visualization tool? What dynamics does it help to illuminate? What other sources might be integrated into score measurement? Have a good exploration!

Categories
Geography MAPS Mobility Networks Social network Social science World

River maps: coloring the world’s circulatory system

Rivers are fundamentals in creating the right conditions for life: that is why most cities since ancient civilizations were built along their banks. Rivers form intricate networks linking the main branches and their smaller tributaries. These river webs have been mapped by geographer Szűcs Róbert, dividing our planet’s watersheds into colorful catchment areas, and providing an informative look at how water flows across continents.

Check out the full article on visual capitalist, and take a look at Robert’s wonderful maps!

Watershed Map of the United States & Cascadia – by Szűcs Róbert


Categories
Cities Geography Networks Simulation World

Can cities’ network position explain the probability of violent conflict?

When we consider the global network of cities, is instability an inherent property of certain network positions?

Dr. Weisi Guo from Cardiff University believes this is the case. He recently co-authored a study in which he found that cities with a high network betweenness – that are centrally located in a path that connects different cities in the network-  are more likely to display high levels of violence, including war, terrorism and gang violence. On the other hand, cities with a high degree  or having connections to many other cities – were found to display a low level of violence.

How to interpret these results? the authors develop an agent based model that suggests that cities with fuzzy cultural boundaries, that serve as connections between culturally homogeneous areas, are indeed those with a higher level of betweenness. On the contrary, cities that are more culturally homogeneous turned out to show also a higher degree.

Even if the authors warn against the attempt to establish causality, which cannot be assessed by the study, their methods accurately identify some of the world’s current foci of conflicts such as Damascus, Aleppo and Baghdad but also Veracruz and Tegucigalpa, in central America. Also, the authors identify a number of cities that do not show at present a high level of violence but which might in the future such as La Mecca and Jeddah in Saudi Arabia, Teheran or Kunming in China.

Their study has been extensively covered by BBC   here

Also, you can access the full study, titled “The Spatial Ecology of War and Peace”  here. 

If you want to know more about the authors, they are:


Categories
Cities Economy Misc Networks Social network Vizualization World

The Multipolar Regionalization of Cities in Multinational Firms’ Networks

Rozenblat, C., Zaidi, F., & Bellwald, A. (2017). The multipolar regionalization of cities in multinational firms’ networks. Global Networks, 17(2), 171-194.

Preprint paper

Categories
Mobility Networks Social network Social science Vizualization World

The global flow of people

Explore new estimates of migration flows between and within regions for five-year periods, 1990 to 2010. Click on a region to discover flows country-by-country.
Capture d’écran 2015-08-07 à 23.35.37
Categories
Cities World

Cities’ densities – A comparative approach

Source: London school of economics, 2015Image densités villes

Categories
Communication Geography MAPS Networks Vizualization World World event

Map of the world of the most popular requests on internet 2013

By Jaume Serra published in the “Courrier international” of January 2nd 2014

Capture d’écran 2014-01-02 à 13.57.30

Categories
MAPS Networks Social network Vizualization World

An incredible map of which countries e-mail each other, and why?

The Internet was supposed to let us bridge continents and cultures like never before. But after analyzing more than 10 million e-mails from Yahoo! mail, a team of computer researchers noticed an interesting phenomenon: E-mails tend to flow much more frequently between countries with certain economic and cultural similarities.

see the paper in Washington Post

original paper: State et al. 2013 World internet


email-chart

Categories
Communication MAPS Misc Networks SCIENCE Vizualization World

Science Metrix

A website showing the proximities between sciences, between fields, maps of ontologies:

https://www.science-metrix.com/OntologyExplorer/#app=cde1&8f8c-selectedIndex=2

Capture d’écran 2013-02-26 à 19.40.22

https://www.science-metrix.com/OntologyExplorer/#app=cde1&8f8c-selectedIndex=1

Capture d’écran 2013-02-26 à 19.41.16


Categories
Art Economy Environment SCIENCE Simulation Society Vizualization World

Tomorrow’s world

A guide to the next 150 years

 by BBC news graphics

https://www.bbc.com/future/story/20130102-tomorrows-world

Categories
Cities Communication Economy Environment Geography Graph analysis MAPS Networks SCIENCE Simulation Social network Society Vizualization World

When Networks Network

The magazine Science underline the huge advance made in network analysis. Networks interact, create cascading effects……

read more in Science

Categories
Cities Environment Geography MAPS Vizualization World

Remote sensing tracks relentless urban spread

Looking back through the decades, these snapshots from space — created exclusively for CNN by NASA’s Landsat department in collaboration with the U.S. Geological Survey — reveal the impact of the vast population shift on cities around the world.

https://edition.cnn.com/SPECIALS/world/road-to-rio/satellite-photos-urban-sprawl/index.html

example of LAS VEGAS: