Categories
Complexity Emergence SCIENCE Social network

Emergence and macro-level independency

Recently Philip Ball collaborator of Quanta Magazine in an article  entitled The New Math of How Large-Scale Order Emerges“, discussed some research advances around the question of how emergence emerge in complex systems? He focuses on the work of Fernando Rosas and six other researchers entitled “Software in the natural world: A computational approach to emergence in complex multi-level systems”, which presents  a mathematical framework based on computational mechanics to better understand the phenomenon of emergence.

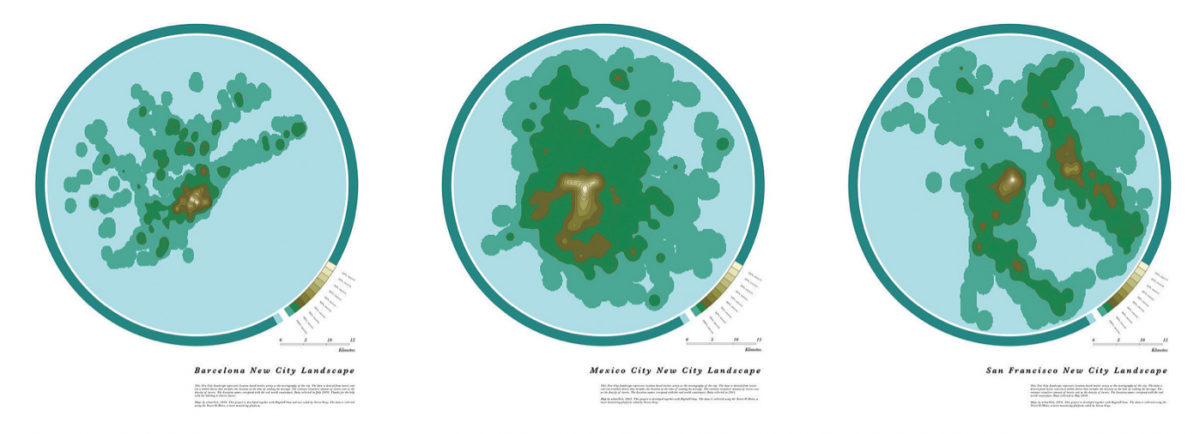
According to the researchers, by organizing systems such as economic, urban or even biological systems into hierarchies of levels, it is possible to find in each of them properties that allow each level to operate independently of the others, just as software does in a computer, each software works independently the computation mechanism of the hardware circuits. This means that emergent phenomena are governed by macroscale rules that appear to be self-contained, regardless of what the components or entities of other hierarchies do.

In general, the approach of Rosas et al. (2024) characterizes the interdependence between micro and macro levels by combining principles of computational mechanics with fluid dynamics and dynamical systems theory, which are widely used in continuous systems. This contribution to bridging the gap between emergence and complex systems is guided by previous research by Barnett & Seth (2023), which proposes a system in which a dynamically macro level is conditional on its own history and independent of the history of the micros process. Both studies turn around systems whose macro levels have a degree of causal ‘self-containment’ with respect to their micro processes, which could be understood as a kind of emergence.

To access the Quanta Magazine article, use this link:

https://www.quantamagazine.org/the-new-math-of-how-large-scale-order-emerges-20240610

For the Rosas et al. (2024) paper:

https://arxiv.org/abs/2402.09090v2

And for the paper by Barnett & Seth (2023):

https://arxiv.org/pdf/2106.06511

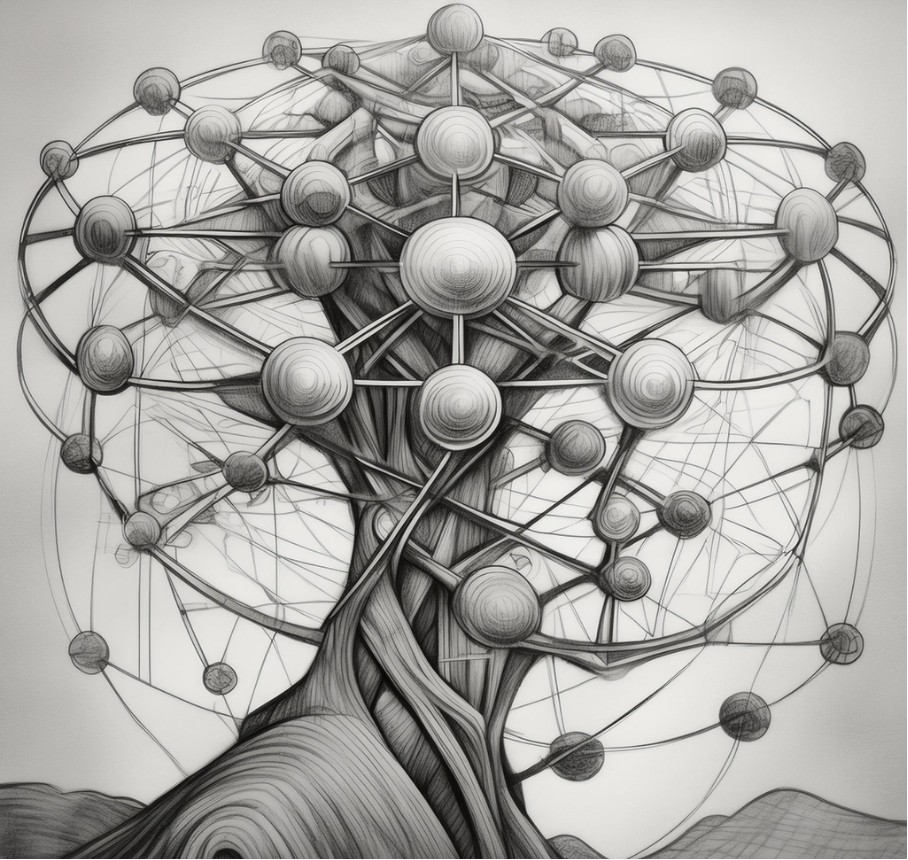
Made in Adobe Firefly AI, prompt: Jorge Salgado.

References:

Barnett, L.  and Seth A. K. 2023. “Dynamical independence: discovering emergent macroscopic processes in complex dynamical systems,” Physical Review E, vol. 108, no. 1, p. 014304.

Rosas, F. E., Geiger, B. C., Luppi, A. I., Seth, A. K., Polani, D., Gastpar, M., & Mediano, P. A. M. (2024). Software in the natural world: A computational approach to hierarchical emergence. arXiv.

Categories
Books Cities Communication Economy Graph analysis History MAPS Misc Networks Resilience SCIENCE Social network Social science Society Vizualization World

Handbook on cities and networks

Edited by Zachary P. Neal, Associate Professor, Department of Psychology, Michigan State University, US and Céline Rozenblat, Professor of Urban Geography, Faculty of Geosciences and Environment,Université de Lausanne, Switzerland

Publication Date: 2021 ISBN: 978 1 78811 470 7 Extent: 672 pp

If you want to understand cities – the innovation and dynamism they generate and the way they sort and segregate people by class, race and other dimensions – you have to start by understanding that cities are networks. Zachary Neal and Céline Rozenblat have done all of us who care about cities a great service by pulling together the very best and brightest thinkers on cities and networks in this terrific volume.
– Richard Florida, University of Toronto, US and author of The Rise of the Creative Class and The New Urban Crisis

This Handbook of Cities and Networks provides a cutting-edge overview of research on how economic, social and transportation networks affect processes both in and between cities. Exploring the ways in which cities connect and intertwine, it offers a varied set of collaborations, highlighting different theoretical, historical and methodological perspectives.

International contributions assess the state of the field of network analysis, presenting interdisciplinary insights that draw on theory from geography, economics, sociology, history, archaeology and psychology, and outlining methodological tools that include ethnographic, qualitative and quantitative approaches. Illustrating a framework for integrating the diversity of urban networks, the Handbook demonstrates that by exploring urban networks with different combinations of levels and scales, new insights and opportunities can emerge.

Featuring focused studies on specific regions and cities, this state-of-the-art Handbook is essential reading for scholars and researchers of urban studies and regional science, particularly those focusing on the transformation of cities as connected spaces through intracity and intercity networks. Its core theoretical insights will also benefit graduate students in urban studies and network analysis.

Categories
Graph analysis Networks SCIENCE Social network Society

A network analysis of Covid-19 vaccines

The rapid development of Covid-19 vaccines has been underpinned by an intricate web of co-patents, intellectual property agreements and lawsuits. Showing them as a network can be useful to highlight the most relevant nodes and the relations they’re embedded into. A preliminary work on this has been recently featured in Nature Biotechnology. Besides reconstructing the main actors in the production of mRNA vaccines, the authors have also analyzed the landscape of scientific terms used in mRNA patents, using a network methodology and the software VOS viewer . A heated debate is underway around the possibility to limit intellectual property rights to facilitate the access to vaccines for developing countries, and network visualization tools can greatly help in understanding the complexity of the relations at stake.

Source: Gaviria and Kilic, 2021: A network analysis of COVID-19 mRNA vaccine patents. Nature Biotechnology, VOL 39, pp. 546–549.

Categories
Europe Geography Graph analysis Networks Social network Vizualization World

Navigating the supply chain network of strategic resources

The European Union has recently acknowledged the strategic role of a number of critical raw materials that are used in the ICT, energy and defense industry. As a result, the Joint Research Center of the European Commission has set up a Raw Materials Information Center that collects legal, economic, trade and policy data on strategic raw materials. A particularly interesting tool is the Supply Chain Viewer, that allows to visualize the global production network of a number of raw materials along with the countries of production and the sectors in which they are employed.

“The raw materials Supply Chain Viewer (SCV) provides an overview of networks of selected raw materials supply chains, consisting of supplying countries, material products, product applications, and economic sectors using such products and materials.

Conceptually, this type of data representation is forming a directed graph, i.e. a network consisting of nodes or vertices (four different types, namely countries, materials, applications and sectors) connected together. These connections (named either links or edges) are representing the flows associated to a specific material. More precisely, in technical terms, this is referred to as an acyclicconnected and oriented graph, i.e. a directed graph without multiple/symmetric edges or loops.[5]

Data for the linkages among countries, materials, product applications and sectors were selected mainly from the EC criticality assessment (CRM 2017)[1]. Such underlying data refer to the period 2010-2014. For several cases, where data were not reported in the CRM 2017, missing data were collected from BGS[3] or Eurostat[4]. On each link, a detailing popup displays the data source. In the SCV graph, data is comprised in the connecting links and not in the nodes, these being simply connecting points in the network[2].”

For more information, you can visit the project page.

Categories
SCIENCE Social network Vizualization

Connected papers: a tool for visualizing the scientific literature network

Network visualizations are a powerful way to make sense of the ties between social entities, and they have often been applied to the scientific network connecting researchers and disciplines. Most of the times, these networks have been constructed through citation analysis. Recently, a group of researchers and entrepreneurs from Israel have launched a new platform called Connected Papers where you can build a network around a paper of your choice. A tie between two papers is established not when they cite each other but when their reference overlap to a large extent. You can read more about their story and methodology here or on the application’s webpage.

Happy network building!


Categories
Graph analysis Social network Vizualization World event

Research on Covid-19: mapping scientific communities and their connections

What scientific literature is being produced and by which different scientific communities on the Covid-19 pandemic? Never before has scientific information been so quickly and widely produced, having a strategic impact in the public response to the Coronavirus crisis.

A group of researchers at the Institute of Complex Systems in Paris have produced an interactive visualization platform in order to map the scientific connections that are emerging around Covid-19. Using the online text mining platform Gargantext, developed within the same institute, they could feed the program a large number of scientific articles that have been analyzed in search of recurring patterns of word co-presence. You can check their work here.

“These maps has been realized using Gargantext from a PubMed Corpora with query “covid-19 OR coronavirus” on April 29 2020 (7.2k documents from Jan 2020 to April 28 2020). The methodology is described here

When you click on a term, the most related terms are displayed in a tag cloud on the right along with the Publications from PubMed that mention the most the selected terms.

In the Conditional map (the first map to be loaded), links between terms represent the conditionnal probability of having one terms knowing the other in a paper (its the confidence measure). It capture the interaction of terms within the document. This map depicts well the different communities working on covid-19 with their own research angle : biological mechanisms, diagnostic, treatments, social consequences, exposure of the elderly, etc. Node size in this maps reflect the degree of the node.

In the Distributional maps links between terms capture a proximity measure that takes into account the profiles of interaction of each term with the others. It can infer relevant relations between terms even if their haven’t co-occur in a paper (second order proximity measure). Node size in this graph is a fonction of the pagerank of the term in the graph.

The mathematical formula of these proximity measure can be found in the Gargantext documentation. “

Categories
Geography MAPS Mobility Networks Social network Social science World

River maps: coloring the world’s circulatory system

Rivers are fundamentals in creating the right conditions for life: that is why most cities since ancient civilizations were built along their banks. Rivers form intricate networks linking the main branches and their smaller tributaries. These river webs have been mapped by geographer Szűcs Róbert, dividing our planet’s watersheds into colorful catchment areas, and providing an informative look at how water flows across continents.

Check out the full article on visual capitalist, and take a look at Robert’s wonderful maps!

Watershed Map of the United States & Cascadia – by Szűcs Róbert


Categories
Geography Mobility Networks SCIENCE Simulation Social network

Google mobility reports: big data to help fight Covid pandemic

Last week Google has published the “COVID-19 Community Mobility report”. In the context of strict confinement measures, and while some governments (China above all but also Italy, France and Spain) have resorted to mobile phone data to assess whether citizens are respecting the lockdown, Google has published anonymized mobility data from a number of countries showing the effect of limitations on individual movements.

The reports use aggregated, anonymized data to chart movement trends over time by geography, across different high-level categories of places such as retail and recreation, groceries and pharmacies, parks, transit stations, workplaces, and residential. We’ll show trends over several weeks, with the most recent information representing 48-to-72 hours prior. While Google displays a percentage point increase or decrease in visits, they do not share the absolute number of visits. To protect people’s privacy, no personally identifiable information, like an individual’s location, contacts or movement, is made available at any point.

In Switzerland, for example, data are available on a national and canton basis, and they show a clear decrease in mobility patterns since the beginning of the lockdown on March 16.

What about your country or local area?

You can access all reports at https://www.google.com/covid19/mobility/


Categories
Geography Simulation Social network Vizualization

An agent-based simulation of coronavirus diffusion

As the coronavirus pandemic continues to spread across the world, governments are taking measures to slow down the spread of the contagion among the population. In fact, while there is no way the virus can be stopped altogether, it is crucial to slow down its diffusion in order no to overload hospitals and intensive care units.

Journalists of the Washington post have created an agent based simulation  in order to explain the importance of social containment measures in which agents, represented as moving dots, move into space getting infected, transmitting the disease and recovering. The four different simulation scenarios  — a free-for-all, an attempted quarantine, moderate social distancing and extensive social distancing — show that when restrictions to the movement are implemented the contagion curve clearly flattens out, while if the agents are left unrestrained the curve of infected people grows exponentially.

This timely piece of data journalism shows the importance of social distancing during this unprecedented global pandemic and interest and the potential of agent-based models to illustrate social dynamics in space.


Categories
Networks SCIENCE Social network

20 years of network science

This month of June marks the 20th anniversary of the seminal paper by Watts and Strogatz:

“Collective dynamics of small world networks”

In this article on Nature, author Alessandro Vespignani elaborates on the importance of this contribution in opening up the multidisciplinary field of what is today known as “network science”.


Categories
Cities Misc Networks Research project Simulation Social network Social science

Theories and models of urbanization

ERC GeoDiverCity International Workshop

Thursday 12th and Friday 13th October 2017 | Paris, France


ERC GeoDiverCity

https://geodivercity.parisgeo.cnrs.fr/blog/international-workshop/

Categories
Cities Economy Misc Networks Social network Vizualization World

The Multipolar Regionalization of Cities in Multinational Firms’ Networks

Rozenblat, C., Zaidi, F., & Bellwald, A. (2017). The multipolar regionalization of cities in multinational firms’ networks. Global Networks, 17(2), 171-194.

Preprint paper

Categories
Cities Economy Misc Networks Research project SCIENCE Simulation Social network Social science Society Vizualization

CCS’15 & CS-DC’15 – Watching again the E-Session on Territorial Intelligence for Multi-level Equity and Sustainability

cropped-cropped-logo2

For those who missed the session Territorial Intelligence for Multi-level Equity and Sustainability, you can visualize online individually each presentation :

Denise Pumain, University Paris 1. ERC GeodiverCity (Keynote Speaker – Conference CS-DC)

World Urban Dynamics and climate change toward territorial intelligence for ensuring sustainability and equity by multi-level governance

Panos Argyrakis, University of Thessaloniki

Comparison of single and multiplex patent networks

Celine Rozenblat, Antoine Bellwald, University of Lausanne

Self reinforcement between urban firm’s networks at local and global scale: Comparison of single and multiplex patent networks

Elfie Swerts, ERC GeodiverCity

Scaling laws in Chinese urban system in light of harmonized data

Olivier Finance, University Paris 1 – CNRS

Scaling laws to explore innovative behavior of transnational investment

Paul Chapron, ERC GeodiverCity

Building and exploring systems of cities models via high performance computing

Denise Pumain, University Paris 1. ERC GeodiverCity

Scaling laws in urban evolution: A construction in territorial intelligence


The entire program of the TRACK “From Fields to territories to the Planet” is available here:

https://cs-dc-15.org/e-tracks/territories/

Categories
Mobility Networks Social network Social science Vizualization World

The global flow of people

Explore new estimates of migration flows between and within regions for five-year periods, 1990 to 2010. Click on a region to discover flows country-by-country.
Capture d’écran 2015-08-07 à 23.35.37
Categories
MAPS Networks Social network Vizualization World

An incredible map of which countries e-mail each other, and why?

The Internet was supposed to let us bridge continents and cultures like never before. But after analyzing more than 10 million e-mails from Yahoo! mail, a team of computer researchers noticed an interesting phenomenon: E-mails tend to flow much more frequently between countries with certain economic and cultural similarities.

see the paper in Washington Post

original paper: State et al. 2013 World internet


email-chart

Categories
Misc Social network Society Vizualization

What is wrong with social networking?

A conversation with scientist and inventor of the World Wide Web Tim Berners-Lee on what is wrong with social networking

Sir Tim berners Lee in DAVOS 2013

Categories
Cities Communication Economy Environment Geography Graph analysis MAPS Networks SCIENCE Simulation Social network Society Vizualization World

When Networks Network

The magazine Science underline the huge advance made in network analysis. Networks interact, create cascading effects……

read more in Science

Categories
Cities Communication MAPS Misc Social network Vizualization

City of London during Olympic Games, maps of twitts

The density of twitter users shows the location of people in London during the Olympic games…. impressive……

See the website:

https://urbantick.blogspot.co.uk/2012/09/virtual-landscape-and-peak-for-london.html

London during Olympic games:

Other cities:

Categories
Cities Geography Graph analysis Research project Simulation Social network Society Vizualization World

New Blog for the ERC project GeoDiverCity

https://geodivercity.parisgeo.cnrs.fr/blog/

Categories
Social network Society Vizualization

The political Blogs networks for the French President elections

A wonderful visualization of the active networks for french elections classified by partis:

see the website: