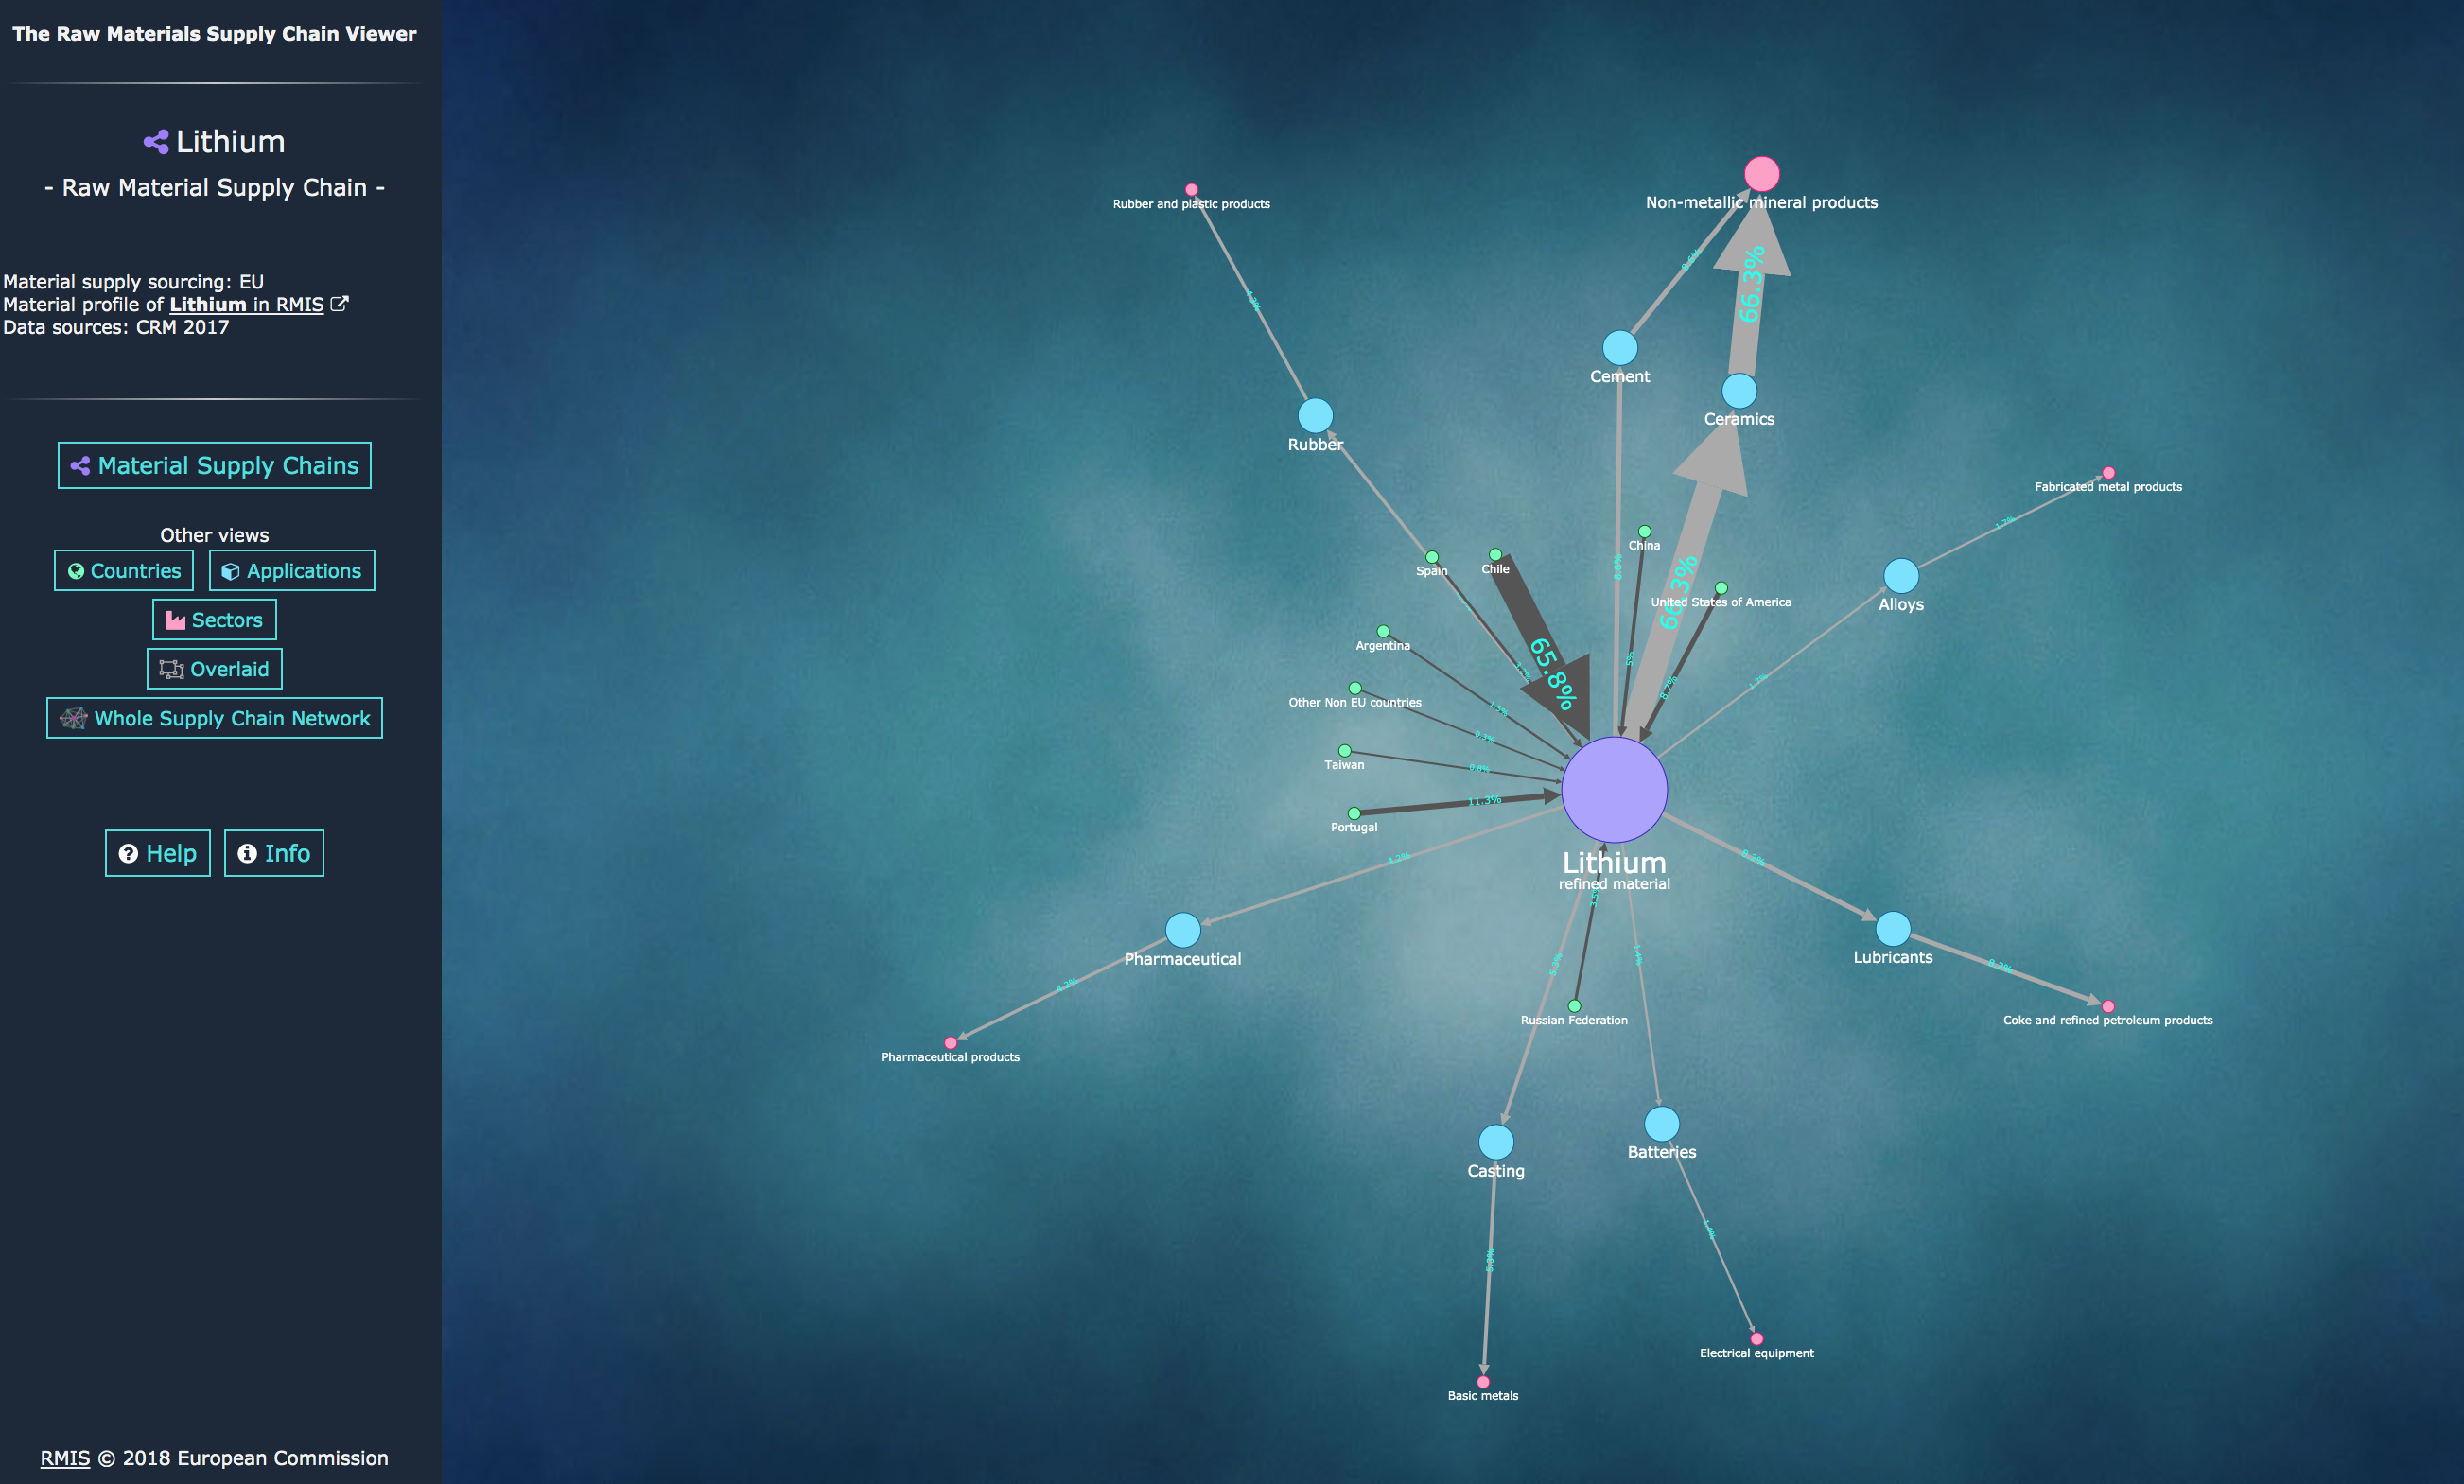
The European Union has recently acknowledged the strategic role of a number of critical raw materials that are used in the ICT, energy and defense industry. As a result, the Joint Research Center of the European Commission has set up a Raw Materials Information Center that collects legal, economic, trade and policy data on strategic raw materials. A particularly interesting tool is the Supply Chain Viewer, that allows to visualize the global production network of a number of raw materials along with the countries of production and the sectors in which they are employed.
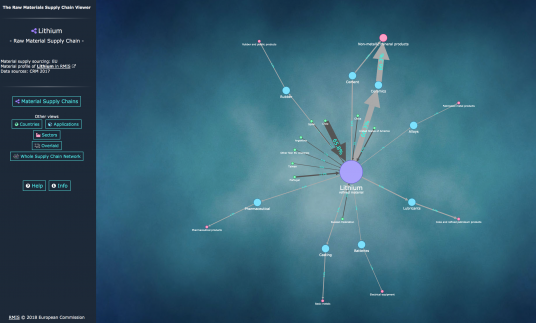
“The raw materials Supply Chain Viewer (SCV) provides an overview of networks of selected raw materials supply chains, consisting of supplying countries, material products, product applications, and economic sectors using such products and materials.
Conceptually, this type of data representation is forming a directed graph, i.e. a network consisting of nodes or vertices (four different types, namely countries, materials, applications and sectors) connected together. These connections (named either links or edges) are representing the flows associated to a specific material. More precisely, in technical terms, this is referred to as an acyclic, connected and oriented graph, i.e. a directed graph without multiple/symmetric edges or loops.[5]

Data for the linkages among countries, materials, product applications and sectors were selected mainly from the EC criticality assessment (CRM 2017)[1]. Such underlying data refer to the period 2010-2014. For several cases, where data were not reported in the CRM 2017, missing data were collected from BGS[3] or Eurostat[4]. On each link, a detailing popup displays the data source. In the SCV graph, data is comprised in the connecting links and not in the nodes, these being simply connecting points in the network[2].”
For more information, you can visit the project page.