Categories
For a year 2025 of peace !


The global pandemic caused by the spread of Covid-19 disease has implied a dramatic reduction of air travel all over the world. Companies have been forced to shrink their operations to the bone, while images of grounded airplanes became the norm. This forced stop will likely have long term consequences and bring to a general restructuring of air transportation. In this contribution three academic experts discuss some of the main issues in this debate:
This article contributes to these issues and stimulates further reflection on the future of air transportation. Have a good read.
What scientific literature is being produced and by which different scientific communities on the Covid-19 pandemic? Never before has scientific information been so quickly and widely produced, having a strategic impact in the public response to the Coronavirus crisis.
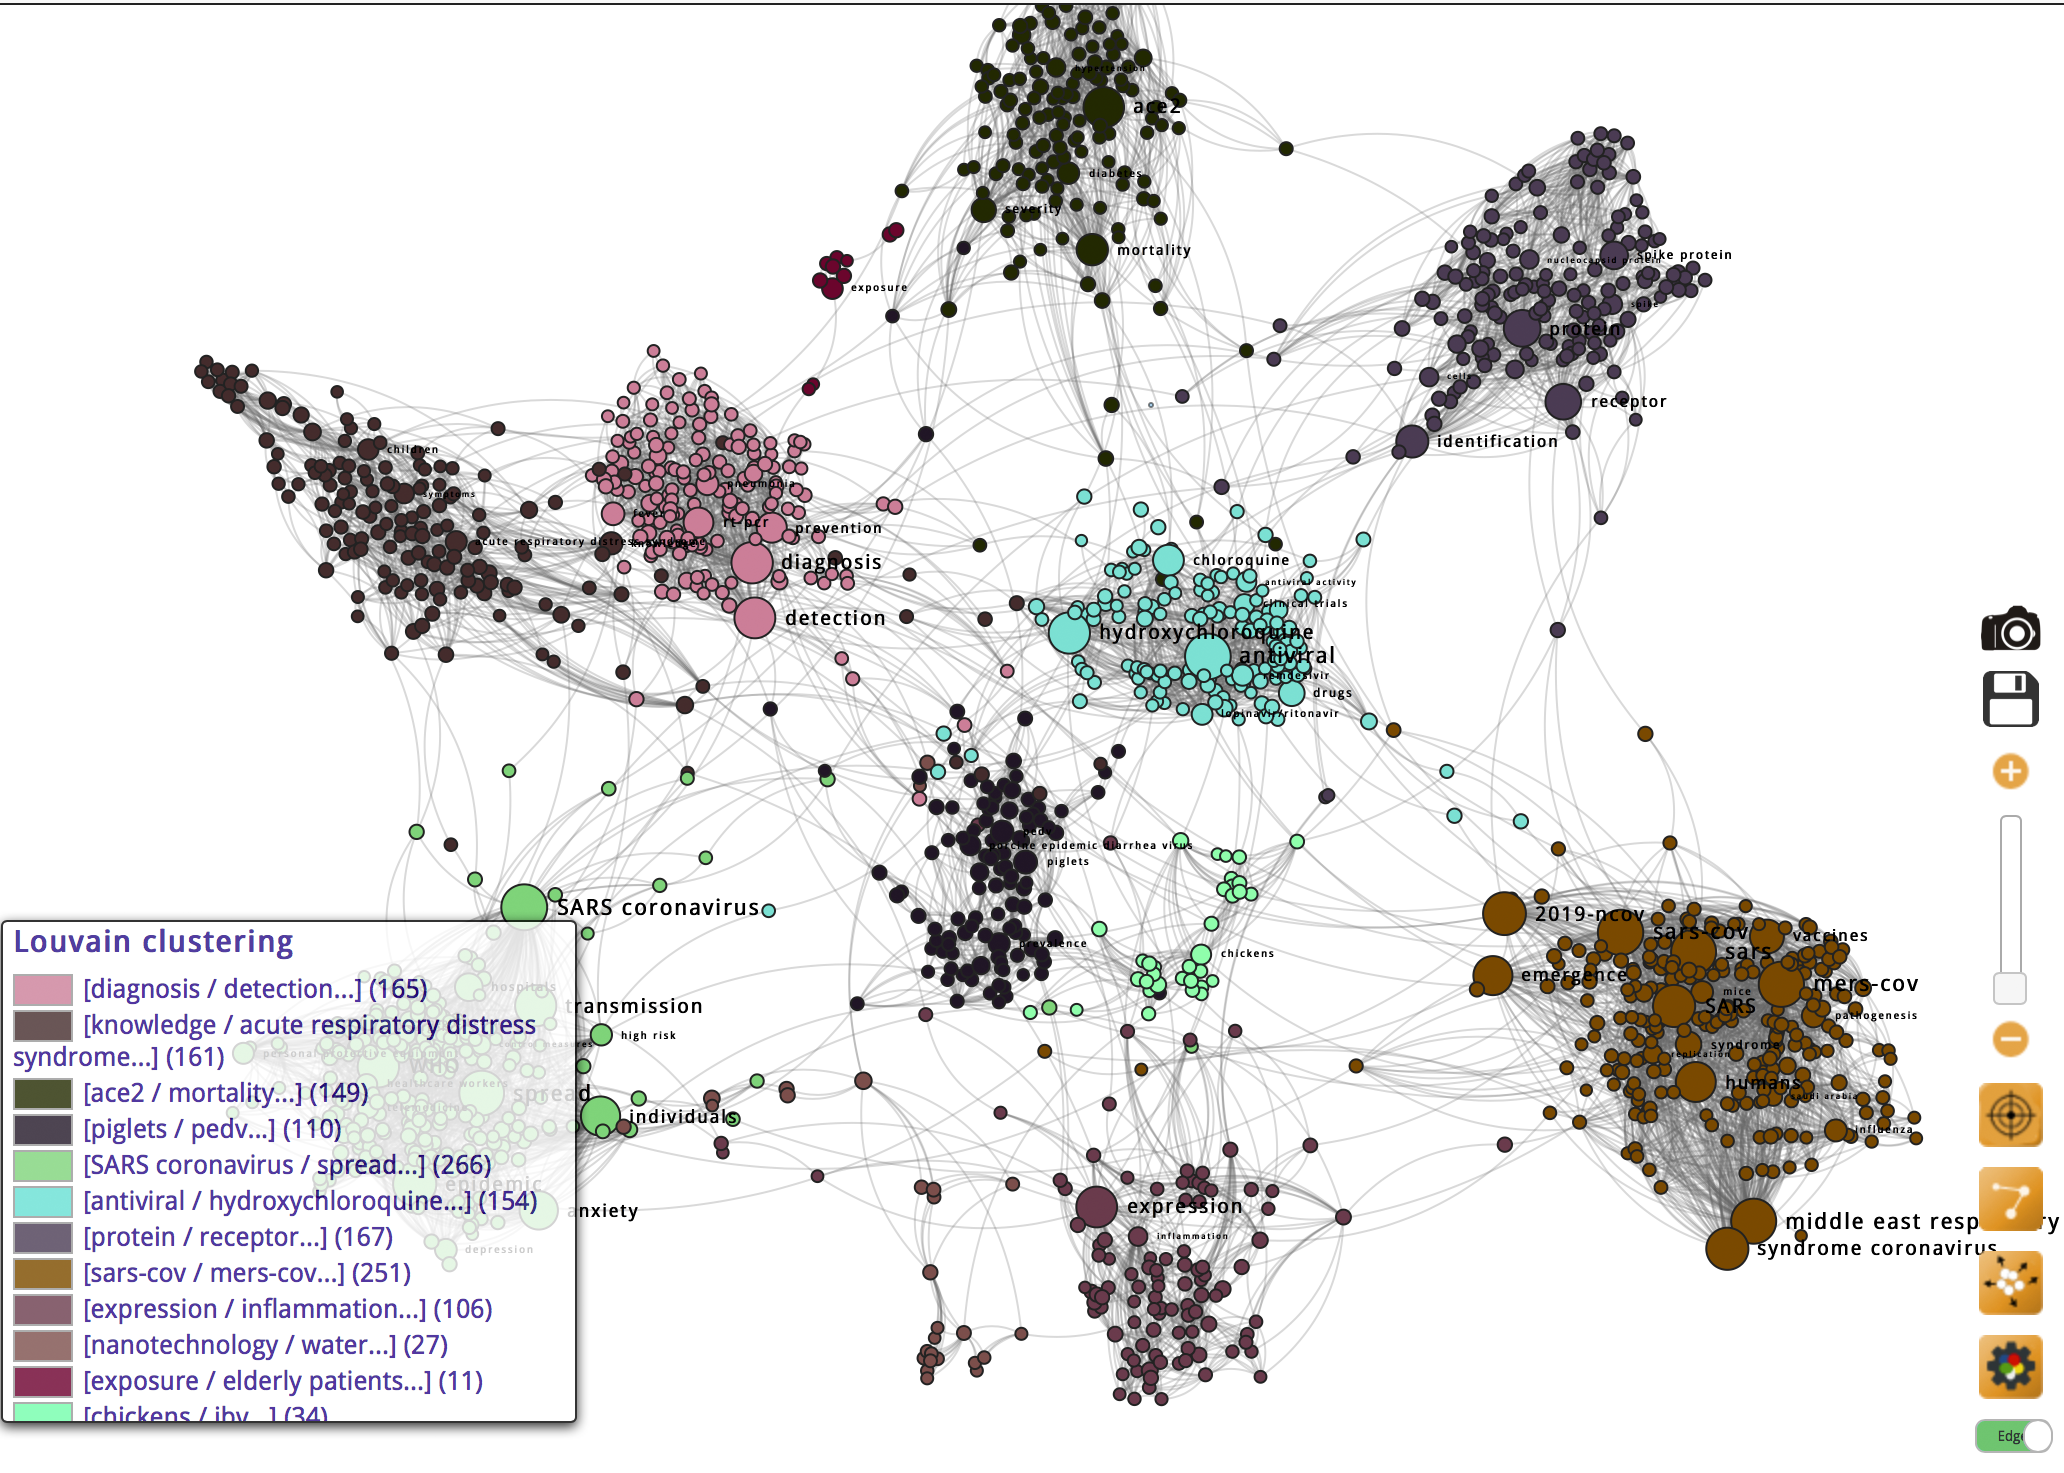
A group of researchers at the Institute of Complex Systems in Paris have produced an interactive visualization platform in order to map the scientific connections that are emerging around Covid-19. Using the online text mining platform Gargantext, developed within the same institute, they could feed the program a large number of scientific articles that have been analyzed in search of recurring patterns of word co-presence. You can check their work here.
“These maps has been realized using Gargantext from a PubMed Corpora with query “covid-19 OR coronavirus” on April 29 2020 (7.2k documents from Jan 2020 to April 28 2020). The methodology is described here
When you click on a term, the most related terms are displayed in a tag cloud on the right along with the Publications from PubMed that mention the most the selected terms.
In the Conditional map (the first map to be loaded), links between terms represent the conditionnal probability of having one terms knowing the other in a paper (its the confidence measure). It capture the interaction of terms within the document. This map depicts well the different communities working on covid-19 with their own research angle : biological mechanisms, diagnostic, treatments, social consequences, exposure of the elderly, etc. Node size in this maps reflect the degree of the node.
In the Distributional maps links between terms capture a proximity measure that takes into account the profiles of interaction of each term with the others. It can infer relevant relations between terms even if their haven’t co-occur in a paper (second order proximity measure). Node size in this graph is a fonction of the pagerank of the term in the graph.
The mathematical formula of these proximity measure can be found in the Gargantext documentation. “

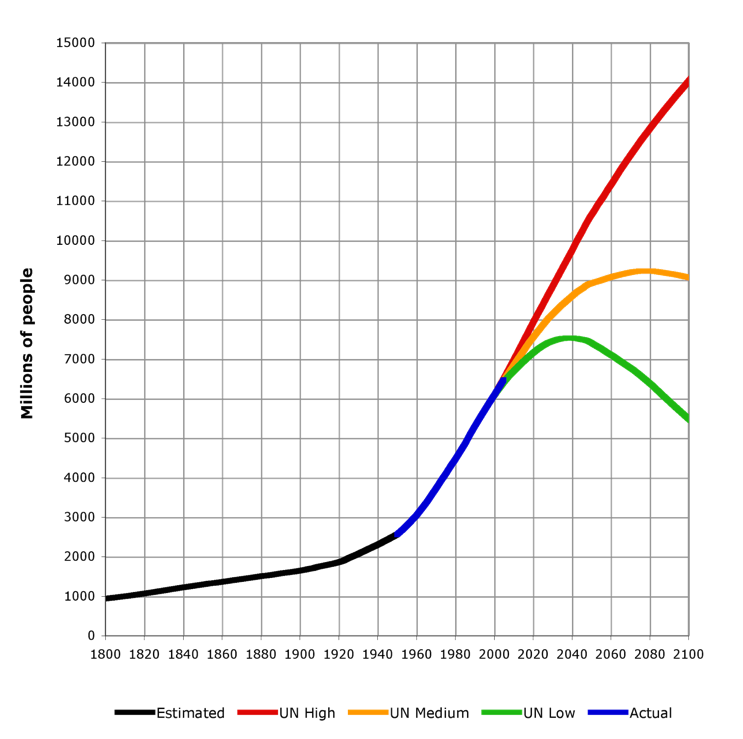
By Jaume Serra published in the “Courrier international” of January 2nd 2014

Previsions of population growth: a very important topic relayed by many blogs (Urban ticks):
https://www.courrierinternational.com/article/2011/04/06/chassez-la-francafrique-elle-revient-au-galop