Categories
Cities Europe Geography Graph analysis History MAPS Networks Simulation Vizualization

ORBIS: the Stanford Geospatial Network Model of the Roman World

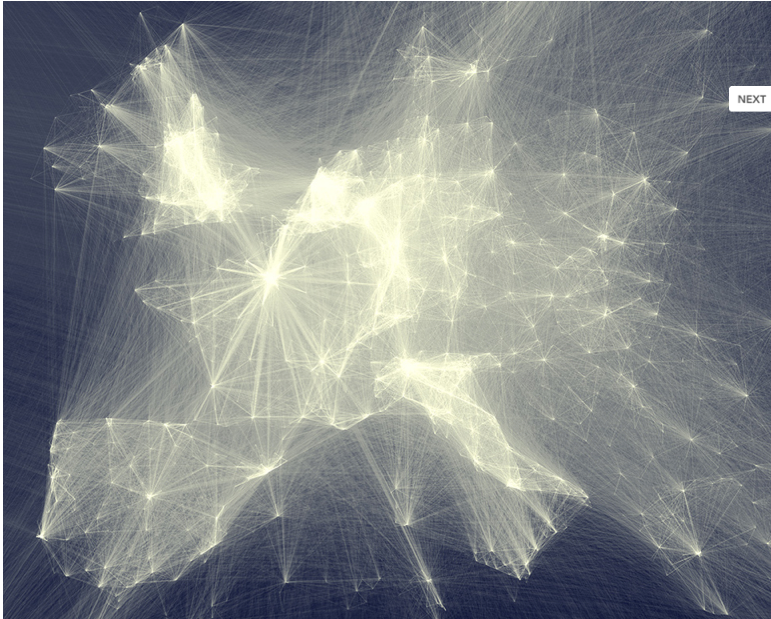
The system calculates the distance from a city to another one, according to faster path, or lower cost.

https://orbis.stanford.edu/

Go to “Mapping ORBIS”, It draws the path and create many different maps and graphs (in “Map gallery”). It’s a pity that the Emperors did not have this system 🙂


Categories
Communication MAPS Misc Networks SCIENCE Vizualization World

Science Metrix

A website showing the proximities between sciences, between fields, maps of ontologies:

https://www.science-metrix.com/OntologyExplorer/#app=cde1&8f8c-selectedIndex=2

Capture d’écran 2013-02-26 à 19.40.22

https://www.science-metrix.com/OntologyExplorer/#app=cde1&8f8c-selectedIndex=1

Capture d’écran 2013-02-26 à 19.41.16


Categories
Art Books MAPS

Interactive maps of Jean-Jacques Rousseau’s letters

Everything is mappable.

The letters written by Jean-Jacques Rousseau are classified by place and time. So you can enter into the Space-time of the author.

https://www.rousseauonline.ch/maps/maps.php

Categories
Cities Communication Economy Environment Geography Graph analysis MAPS Networks SCIENCE Simulation Social network Society Vizualization World

When Networks Network

The magazine Science underline the huge advance made in network analysis. Networks interact, create cascading effects……

read more in Science

Categories
Art Cities Environment Geography MAPS Misc Vizualization

Dissection of cities

I don’t know what we can learn from the physical dissection of cities: maybe some fractal analysis could work?

see the website

Berlin:

New York City:

and other cities in the website (made by Armelle Caron)

Categories
Cities Communication MAPS Misc Social network Vizualization

City of London during Olympic Games, maps of twitts

The density of twitter users shows the location of people in London during the Olympic games…. impressive……

See the website:

https://urbantick.blogspot.co.uk/2012/09/virtual-landscape-and-peak-for-london.html

London during Olympic games:

Other cities:

Categories
Cities Environment Geography MAPS Vizualization World

Remote sensing tracks relentless urban spread

Looking back through the decades, these snapshots from space — created exclusively for CNN by NASA’s Landsat department in collaboration with the U.S. Geological Survey — reveal the impact of the vast population shift on cities around the world.

https://edition.cnn.com/SPECIALS/world/road-to-rio/satellite-photos-urban-sprawl/index.html

example of LAS VEGAS:


Categories
MAPS Simulation Society Vizualization World

Interactive maps of the world population on the INED website

a terrific tool to give to students, children, citizens of the world….

https://www.ined.fr/en/everything_about_population/interactive_maps/

See the instructions:

publi_pdf2_pesa485

Categories
Cities MAPS Society Vizualization

Sound Maps

To make the maps more “real”, add sounds….. In Montreal, they did it.

https://www.montrealsoundmap.com/?lang=en

Also England: https://sounds.bl.uk/uksoundmap/fusionmap.aspx

Categories
Cities Geography History MAPS

Africapolis

Atlas of African cities on Google Earth (of course you must have already downloaded Google Earth):

Website

Click on

Display Africapolis data in Google Earth

and then you access to many information from the “GEOPOLIS” database of François Moriconi

Categories
Cities History MAPS Vizualization

The Digital Archaeological Atlas of the Holy Land

Spatial Search – Draw a Search Area on the Map to Retreive Site Points in Google Earth

WEBSITE of DAAHL

Categories
Geography History MAPS

Gapminder

The Graphic Show of the World development evolution……

Gapminder Website

Categories
MAPS Social network

Map of scientific collaboration between researchers