
Spatial Ecology Lab
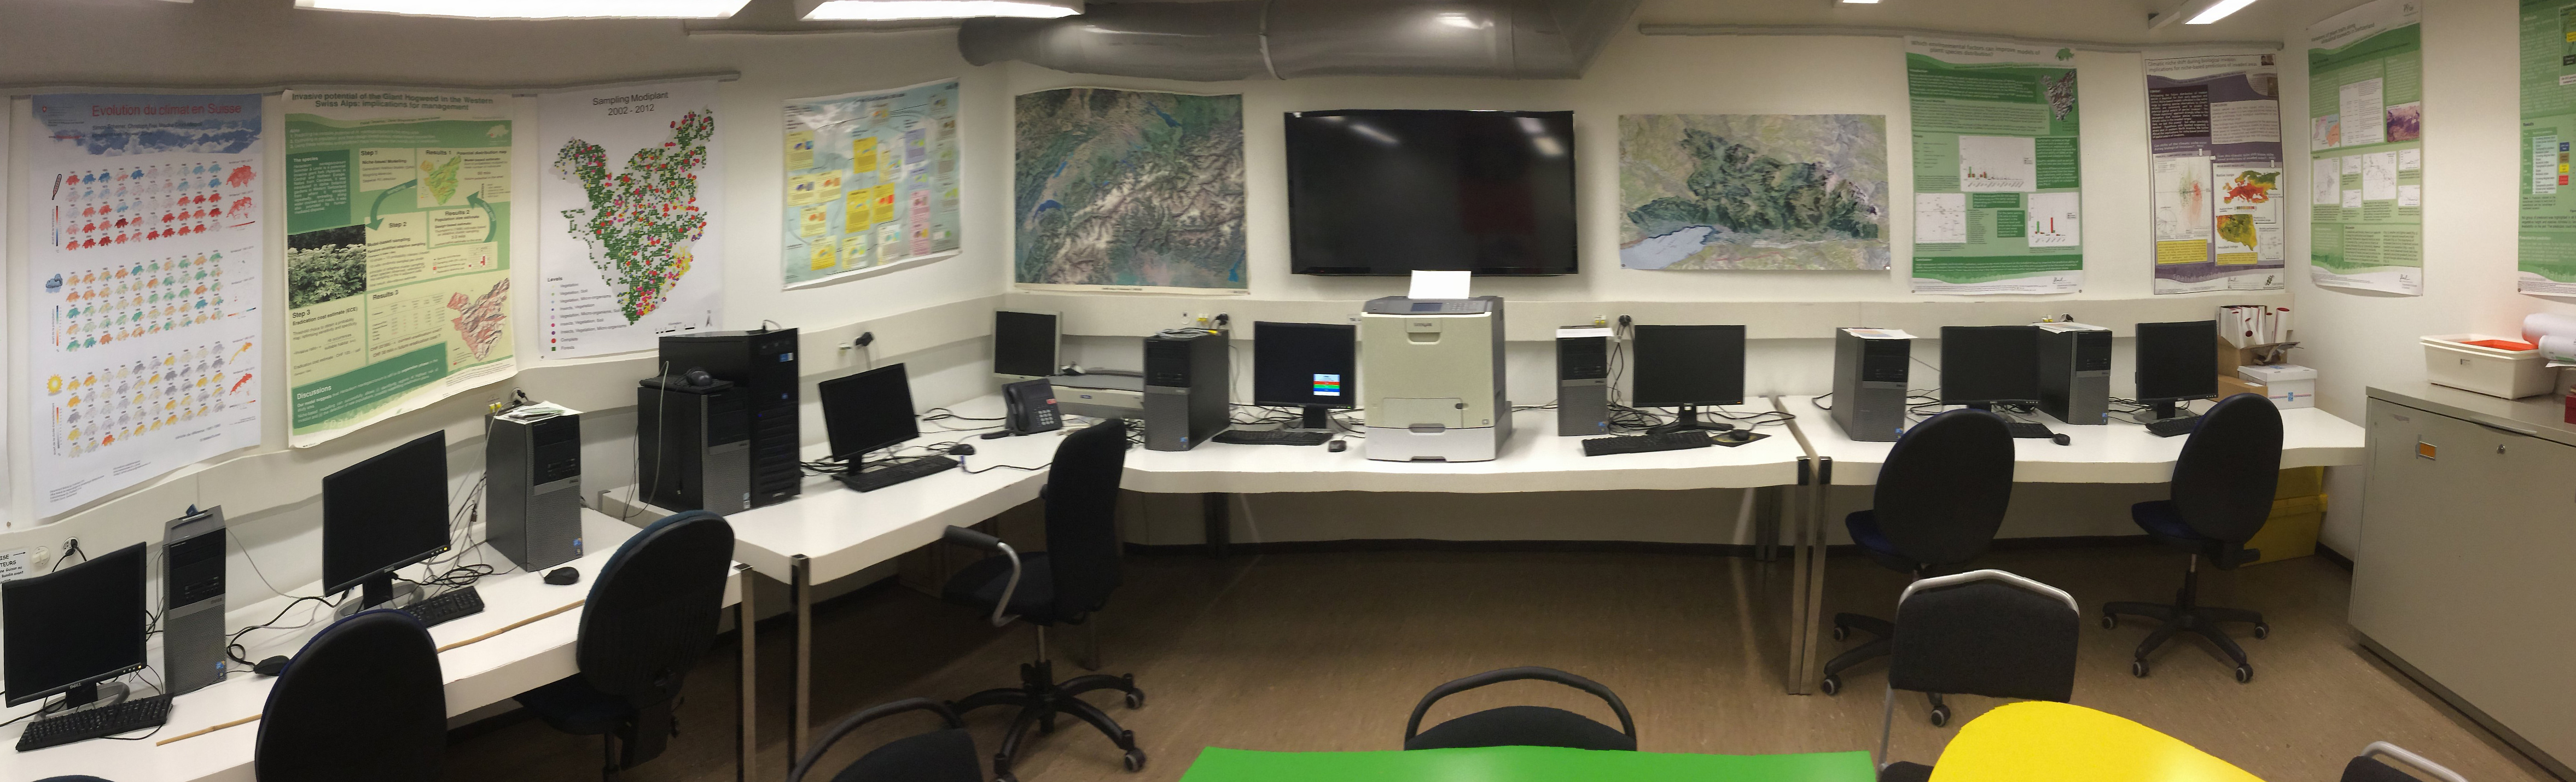
Research could not be done without the appropriate resources. Here are the tools, data and material we make available to the scientific community
Data
Ecospat data on Dryad
- Scherrer D, Esperon-Rodriguez M, Beaumont L, Barradas, VL, Guisan, A (2021). Data from: National assessments of species vulnerability to climate change strongly depend on selected data sources. Dryad Digital Repository: doi.org/10.5061/dryad.qnk98sfg5
- D’Amen M, Mod HK, Gotelli NJ, Guisan A (2017). Data from: Disentangling biotic interactions, environmental filters, and dispersal limitation as drivers of species co-occurrence. Dryad Digital Repository: doi.org/10.5061/dryad.8mv11
- Dubuis, A., Pottier, J. & Guisan, A. (2017). Data from:Improving spatial predictions of taxonomic, functional and phylogenetic diversity. Dryad Digital Repository. dx.doi.org/10.5061/dryad.cn921
- Pottier J, Malenovský Z, Psomas A, Homolová L, Schaepman ME, Choler P, Thuiller W, Guisan A, Zimmermann NE (2014) Data from: Modelling plant species distribution in alpine grasslands using airborne imaging spectroscopy. Biology Letters dx.doi.org/10.5061/dryad.n13hn
- Carvalho SB, Gonçalves J, Guisan A, Honrado J (2015) Data from: Systematic site selection for multispecies monitoring networks. Journal of Applied Ecology dx.doi.org/10.5061/dryad.qt3c9
- Ndiribe C, Pellissier L, Antonelli S, Dubuis A, Pottier J, Vittoz P, Guisan A, Salamin N (2013) Data from: Phylogenetic plant community structure along elevation is lineage specific. Ecology and Evolution dx.doi.org/10.5061/dryad.q0fh6734
- Bidegaray-Batista L, Sánchez-Garcia A, Santulli G, Maiorano L, Guisan A, Vogler A, Arnedo M (2016) Data from: Imprints of multiple glacial refugia in the Pyrenees revealed by phylogeography and palaeodistribution modelling of an endemic spider. Molecular Ecology dx.doi.org/10.5061/dryad.k3v8j
- Henry P, Le Lay G, Goudet J, Guisan A, Jahodova S, Besnard G (2009) Data from: Reduced genetic diversity, increased isolation and multiple introductions of invasive giant hogweed in the western Swiss Alps. Molecular Ecology dx.doi.org/10.5061/dryad.1237
- Pellissier L, Niculita-Hirzel H, Dubuis A, Pagni M, Guex N, Ndiribe C, Salamin N, Xennarios I, Goudet J, Sanders IR, Guisan A (2014) Data from: Soil fungal communities of grasslands are environmentally structured at a regional scale in the Alps. Molecular Ecology dx.doi.org/10.5061/dryad.88fm3
- Guisan A, Dubuis A, Vittoz P (2011) Data from: Predicting spatial patterns of plant species richness: a comparison of direct macroecological and species stacking modelling approaches. Diversity and Distributions dx.doi.org/10.5061/dryad.28d4k
Ecospat data on GitHub
- Broennimann O, et la. (2021). Data from: Distance to native climatic niche margins explains establishment success of alien mammals. GitHub Repository: github.com/ecospat/NMI
Field sampling of plants in open habitats in the Prealps of Canton of Vaud
Bioclim variables for Southern South America
19 bioclimatic variables based on Nix 1985, derived from a dataset of monthly climatic variables (1950-2000, 1 km spatial resolution) created with Anusplin software (Hutchinson 2006).
Suggested citation: Pliscoff, P., Luebert, F., Hilger, H. H., & Guisan, A. (2014). Effects of alternative sets of climatic predictors on species distribution models and associated estimates of extinction risk: A test with plants in an arid environment. Ecological Modelling, 288, 166–177
Files are available upon request at olivier.broennimann@unil.ch
Swiss Eco-Climatic GIS data
The different eco-climatic GIS layers available for Switzerland. Information is provided about the methods used for the creation of the layers as well as their interdependences and correlations. For an updated version of climatic data, see the CHclim25 section below.
CHclim25
Climatic dataset for Switzerland downscaled from MeteoSwiss gridded data at 1km to 25m using local regressions. It provides up-to-date climatic data at a resolution of 25m for Switzerland that are compatible with the 5th assessment report of the IPCC (AR5; reference period 1981-2010). The dataset is derived from daily MeteoSwiss Grid-Data Products at 1km resolution for 1981-2020 (daily mean/max/min temperatures (TaveD/TminD/TmaxD), daily sum of precipitation (PrecD ), daily relative sunshine duration (SrelD)), and monthly potential incoming solar radiations (Srad) calculated at 25m for Switzerland by WSL. Transient daily time series of gridded climate scenarios of temperature and precipitations between 1981-2099 at 0.02°D (~2.2 km) from the CH2018 initiative used to calculate future climatic layers for 3 GCMs (HADGEM, ECEARTH, MPIESM, and IPSL), 3 time slices (2020-2049, 2045-2074, and 2070-2099) and 2 representative concentration pathways (RCP 4.5 and 8.5).
Monthly and yearly data are available on Zenodo. Daily data are available upon request at olivier.broennimann@unil.ch
Technical report: Broennimann, O. (2018). CHclim25: A high spatial and temporal resolution climate dataset for Switzerland. Technical report. Ecospat laboratory, University of Lausanne, Switzerland. Report pdf
Tools
R package ‘ecospat’
Miscellaneous methods and utilities for spatial ecology analysis, written by current and former members and collaborators of the ecospat group. For more details you can read the following book chapter and paper:
- Broennimann, O., Collart, F., Guisan, A. (2026). The ecospat R Package: A Collection of Pre-, Core-, and Post-Modeling Tools to Investigate Species Niches and Distributions. In: Rocchini, D. (eds) R Coding for Ecology. Use R!. Springer, Cham. https://doi.org/10.1007/978-3-031-99665-8_3
- Di Cola, V., Broennimann, O., Petitpierre, B., Breiner, F.T., D’Amen, M., Randin, C., Engler, R., Pottier, J., Pio, D., Dubuis, A., Pellissier, L., Mateo, R.G., Hordijk, W., Salamin, N. and Guisan, A. (2017), ecospat: an R package to support spatial analyses and modeling of species niches and distributions. Ecography, 40: 774-787. https://doi.org/10.1111/ecog.02671
The ecospat package offers the possibility to perform Pre-modelling Analysis, such as Spatial autocorrelation analysis, MESS (Multivariate Environmental Similarity Surfaces) analyses, Phylogenetic diversity Measures, Biotic Interactions. It also provides functions to complement biomod2 in preparing the data, calibrating and evaluating (e.g. boyce index) and projecting the models. Complementary analysis based on model predictions (e.g. co- occurrences analyses) are also provided. In addition, the ecospat package includes Niche Quantification and Overlap functions that were used in Broennimann et al. 2012 and Petitpierre et al. 2012 to quantify climatic niche shifts between the native and invaded ranges of invasive species.
You can install the ecospat package in R from CRAN or GitHub . CRAN provides the most stable version. GitHub provides the most updated functions but not fully tested yet. Check out the latest updates available on GitHub .
1) installation from CRAN in the R console:
> install.packages(« ecospat »)
> library(ecospat)
2) installation from GitHub in the R console:
> install.packages(« devtools »)
> library(devtools)
> install_github(repo= »ecospat/ecospat/ecospat »)
> library(ecospat)
Examples of how to use the functions can be found in the vignette of the ecospat package
R package ‘NSDM’
Uniting species distribution modelling (SDM) techniques into one high-performance computing (HPC) pipeline, we developed N-SDM, an SDM platform aimed at delivering reproducible outputs for standard biodiversity assessments. N-SDM was built around a spatially-nested framework, intended at facilitating the combined use of species occurrence data retrieved from multiple sources and at various spatial scales. N-SDM allows combining two models fitted with species and covariate data retrieved from global to regional scales, which is useful for addressing the issue of spatial niche truncation. The set of state-of-the-art SDM features embodied in N-SDM includes a newly devised covariate selection procedure, five modelling algorithms, an algorithm-specific hyperparameter grid search and the ensemble of small-models approach. N-SDM is designed to be run on HPC environments, allowing the parallel processing of thousands of species at the same time.
All the information required for installing and running N-SDM is openly available on GitHub .
Adde A., Rey P.L., Brun P., Külling N., Fopp F., Altermatt F., Broennimann B., Lehmann A., Petitpierre B., Zimmermann N. E., Pellissier L., Guisan A. 2023. N-SDM: a high-performance computing pipeline for Nested Species Distribution Modelling. Ecography. In press. doi:10.1111/ecog.06540.
R package ‘covsel’
The covsel R package is a ready-to-use, automated, covariate selection tool for species distribution modelling. It implements and streamlines the two steps of our novel “embedded” covariate selection procedure that combines (Step A) a collinearity-filtering algorithm and (Step B) three model-specific embedded regularization techniques, including generalized linear model with elastic net regularization, generalized additive model with null-space penalization, and guided regularized random forest.
All the information required for installing and running N-SDM is openly available on GitHub .
Adde A., Rey P.L., Fopp F., Petitpierre B., Schweiger A.K., Broennimann B., Lehmann A., Zimmermann N. E., Altermatt F., Pellissier L., Guisan A. 2023. Too many candidates: Embedded covariate selection procedure for species distribution modelling with the covsel R package. Ecological Informatics. In press. doi:10.1016/j.ecoinf.2023.102080 .
R package ‘MigClim’
MigClim is an R package which allows simulating plant dispersal under climate change and landscape fragmentation scenarios. MigClim allows implementing various parameters, such as dispersal distance, increase in reproductive potential over time, landscape fragmentation or long-distance dispersal.
Reference :
Engler R. and Guisan A., 2009. MIGCLIM: Predicting plant distribution and dispersal in a changing climate. Diversity and Distribution, 15 (4), 590-601.
Engler R., Randin C.F., Vittoz P., Czáka T., Beniston M., Zimmermann N.E., Guisan A., 2009. Predicting future distributions of mountain plants under climate change: does dispersal capacity matter? Ecography, 32 (1), 34-45.
Engler R., Hordijk W., Guisan A., 2012. The MIGCLIM R package – seamless integration of dispersal constraints into projections of species distribution models. Ecography, 35 (10), 872–878.
…and don’t miss out the presentation video of Migclim featuring Robin Engler at the Global Online Seminar in Biodiversity Informatics help by A. Townsend Peterson at the University of Kansas: Youtube link
Niche overlap
The R package ‘ecospat’ R now includes the functions to perform measures of niche overlap and niche equivalency/similarity tests.
Short tutorial:
Set your working directory to a folder containing your datasets of occurences data (delimited text file with column names x,y) and datasets of points representing the study areas with environmental values (column names should be x,y,X1,X2,…,Xn). Unzip the user scripts.The user scripts allow setting the analyses for the calculations with an example data. Use user_script_2sp_2A.R if you want to compare niches of 2 species in different areas (e.g. invasive species). Use user_script_Nsp_1A.R if you want to compare niches of n species in the same area. The scripts use species occurrence online and climatic data from worldclim.org, but you can modify the code to import and use your own data.
If you encounter a problem during your analyses, please read this FAQ
Reference:
Broennimann O. , Fitzpatrick M.C. , Pearman P.B. , Petitpierre B. , Pellissier L. , Yoccoz N.G. , Thuiller W. , Fortin M.J. , Randin C.R. , Zimmermann N.E. , Graham C.H. , Guisan A. 2012. Measuring ecological niche overlap from occurrence and spatial environmental data. Global Ecology and Biogeography 21(4): 481-497. DOI
Biomapper
Link to the BIOMAPPER software for predicting species occurrences developped by Alex Hirzel at UNIL.
Canogen
Get the zip CANOGEN AML developped by Andrew D. Weiss and Stuart B. Weiss to predict plant distribution in ARCINFO directly from CANOCO outputs (see Guisan, A., Weiss, S.B. & Weiss, A.D. 1999. GLM versus CCA spatial modeling of plant species distribution. Plant Ecology 143(1) : 107-122)
Credits : Thanks to acknowledge Andy and Stu in any related publication ! Contact weiss.andrew (a) epamail.epa.gov.
Material
To borrow material please fill this online form and contact olivier.broennimann@unil.ch
GPS and accessories
| Item | Quantity | Description | Documentation |
|---|---|---|---|
| Garmin – Etrex summit | 6 | GPS 150g with precision between 5-15m, no USB port | user guide pdf |
| Garmin – Etrex 10 | 2 | GPS 140g with precision between 5-15m, with USB port | user guide pdf |
| Trimble – Geo7X | 4 | Handheld GNSS device 3.5kg with ArcPad 10.2 and Trimble Positions, GPS + GLONASS. Precision < 2m. Post-correction available. | user guide pdf |
| Trimble R2 + ArcGis online + Field Maps | 5 | GNSS receiver 1.08kg coupled with smartphone. GPS + GLONASS + Beidou + Galileo. Precision up to 7cm using swipos RTK. No post-correction. | user guide pdf |
| Trimble – Tempest Antenna | 3 | antenna for Trimble GeoExplorer | |
| Garmin – inReach Mini | 5 | Lightweight safety Satellite Communicator. Sends an SOS with your coordinates to a rescue team. | website |
| Samsung – Galaxy Tab Active2 | 4 | Water-resistant, rugged tablet + SIM card | website |
| Trimble – T7 Tablet with TerraFlex | 1 | Water-resistant, rugged tablet to use with R2 reciever. 1.2kg. Stores rinex files for post-correction (when no GSM available) | website |
| Leica – GPS1200+ | 1 | GPS mobile 4.5kg with antenna in Rover backpack + base station with precision up to 1cm | user guide pdf |
Measurements
| Item | Quantity | Description | Documentation |
|---|---|---|---|
| ibutton – Thermochron DS1922L#F50 | >200 | iButton Temperature logger with 8KB Data-Log Memory | website |
| ibutton- connecter DS1402-RP3 | 3 | iButton probe (+ USB-RJ11 adapter DS9490R#) for the transfer of data to and from DS19xx | website |
| TempTec-R – ibutton reader | 1 | Reader can store files from 400 loggers for DS1922 & DS1923 iButton temperature, and temperature and humidity data loggers | website |
| Medisana – infrared thermometer | 1(2?) | Precise contact-free temperature measurement (from 5cm away). Stores 30 measurements. | website |
| Spectrum – FieldScout TDR 300 | 4 | Soil Moisture Meter (+TDR rods 7.5cm 6429FS3) | website |
Maps
| Item | description | link |
| National Map 1:25’000 | The most accurate and detailed topographic map of Switzerland | website |
| National Map 1:50’000 | The 2nd most accurate and detailed topographic map of Switzerland | website |
To borrow material please fill this online form and contact olivier.broennimann@unil.ch