Categories
Art Cities Resilience Vizualization

Resi-city: art, cities, resilience

Credits: resi-city.com

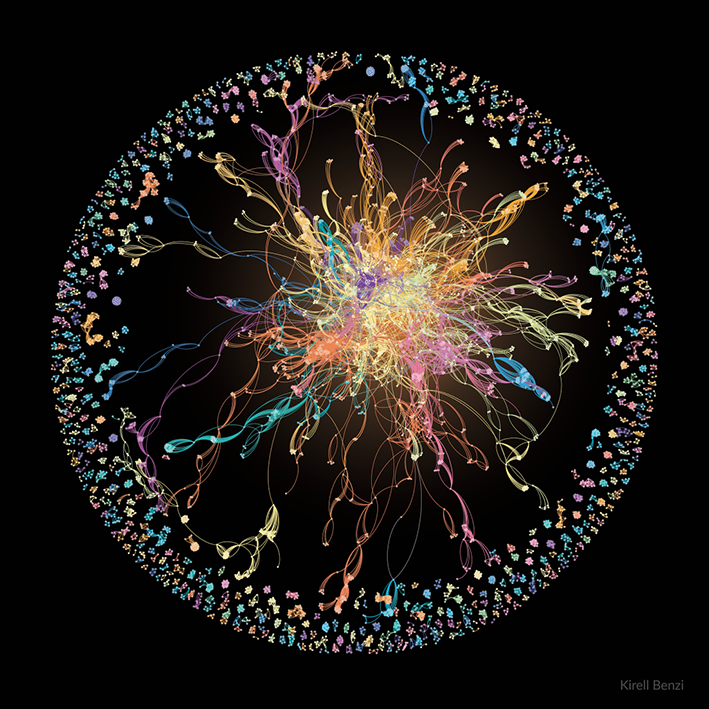
What is the meaning of a map? Is it an objective tool or a representation of values? “H. Mazurek invites us to compare the points of view of the geographer as opposed to the cartograph. The author argues that the first one should overcome a cartesian vision and engage in the construction of spaces where territoriality and human behavior are intrinsically linked. Through a critical approach of how maps should represent the true meaning of places and their historical scope, this publication reminds us that spaces are social constructions and indirectly questions the significance of humanitarian mapping. “

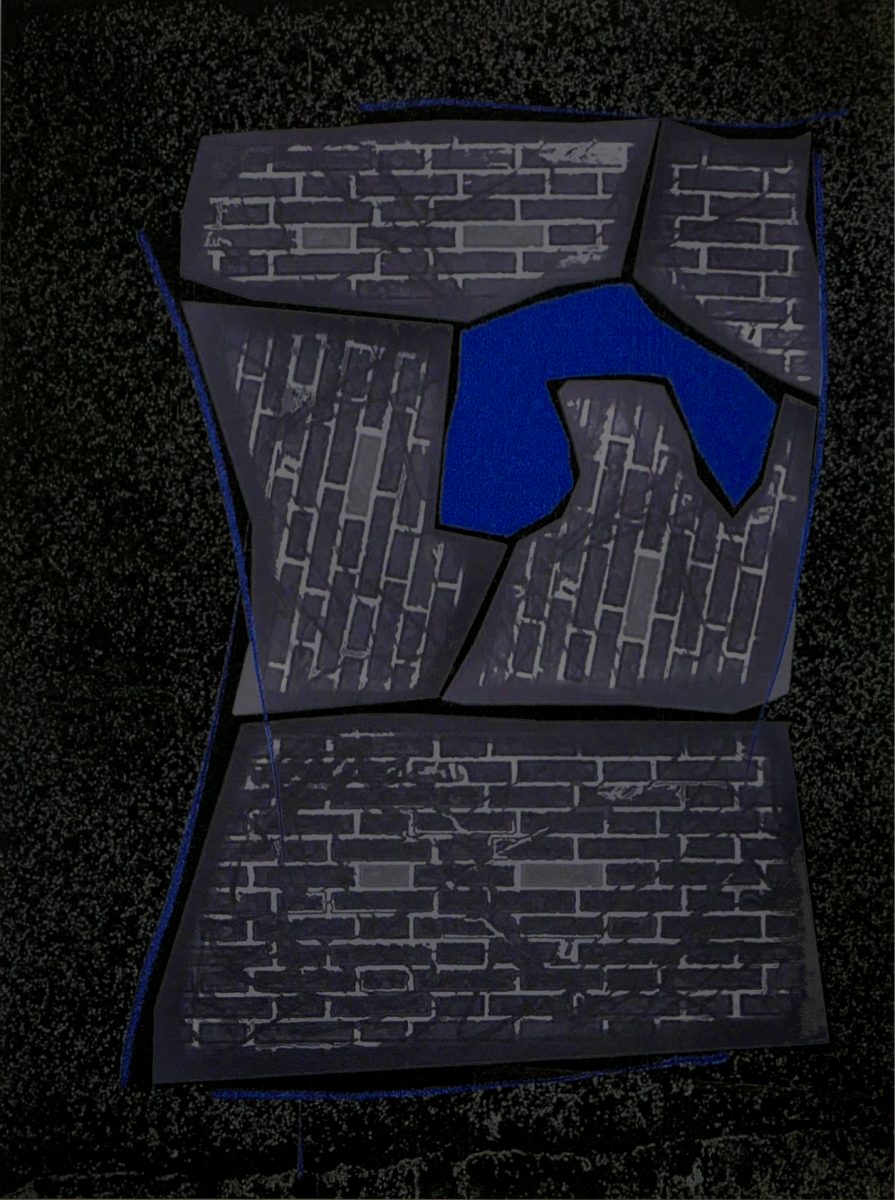
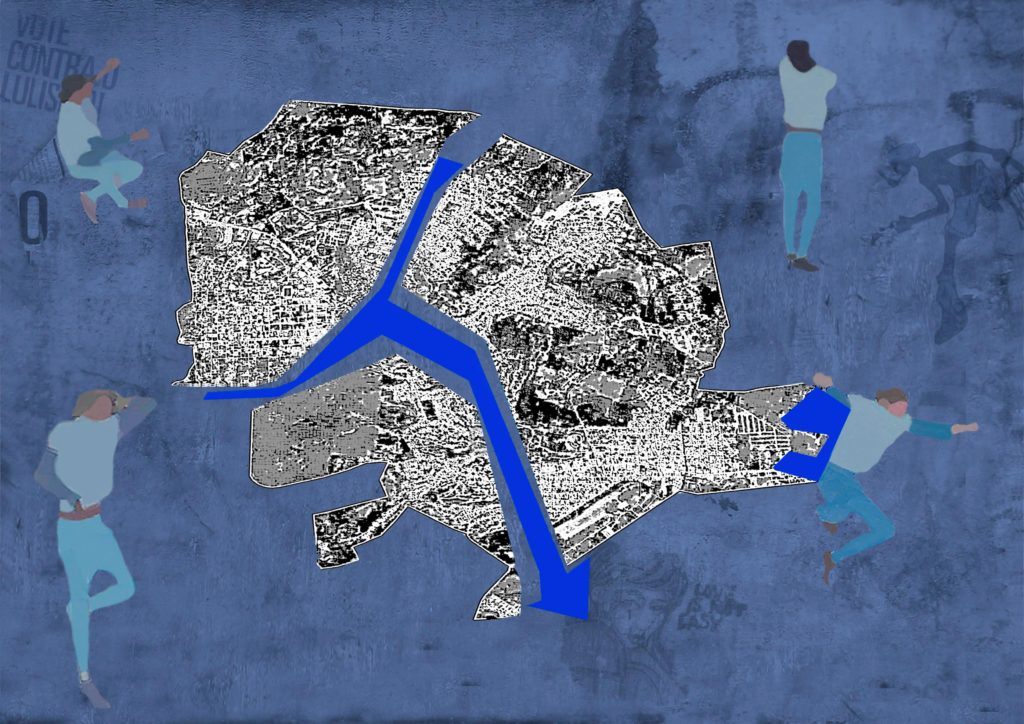
“The below “virtual” collage is inspired by PCdO Campos & I Paz study (12) on the mapping of Itaperuna, Rio de Janeiro, BR. In January 2020, the worst floods registered since 1932 impacted dramatically this urban area. The map itself shows the flood occurrence of the Muriae river during the event. The study used highly skilled techniques based on fractal analysis investigating the (lack of) drainage performance and its impact on flooding cartography usage. Confronting the absolute objectivity of sophisticated measurements to the inherent subjectivity of human behavior translates here into a deconstruction-reconstruction process of the mapping. Itaperuna looks fragmented in three parts, but together with the river and its redesigned flooding, they constitute an indissociable whole and an integral part of the social space. All around, silhouettes are talking, lying down, dancing or listening on a background of graffiti, a way to recall the challenge of pedagogy when teaching to non-expert citizens the meaning of urban resilience.”

More info here

Categories
Art Books History MAPS Networks

Mapping Philosophy in the Paris metro

An interesting network interactive vizualization of philosophy where lines and connections are more important than the proximity in the network… follow each line to know more about a philosophical (sometimes literature or artistic) domain (unfortunately in French)

https://lesphilosophesdanslemetro.com/plan/

Categories
Art Graph analysis Networks Vizualization

“L’art trouble, la science rassure” – Bringing art and network analysis together

Kirell Benzi is a data artist, speaker and data visualization lecturer. He holds a Ph.D. in Data Science since 2016, which he obtained at EFPL (Ecole Polytechnique Fédérale de Lausanne).

Building on very heterogeneous datasets (collaborations between musicians, patents, corporate links and much more) Kirell created a number of artistic network visualizations in which the insights from data are powerfully supported by the strength of the representation.

Please visit his outstanding network art gallery at: https://www.kirellbenzi.com

The featured image shows the network of Montreux Jazz musicians:

“This network shows with whom musicians of the festival play with, revealing two different categories of artists. At the border of the ring, we have the artists who only perform with their band, forming many disconnected communities. On the opposite, those who jam with everyone, the stars of the festival, are well-connected and are naturally located in the center of the ring. One of the brightest stars was George Duke, the champion of appearances at the festival with 53 concerts. In the center in orange, he faces the legendary guitarist Santana in purple.”


Categories
Art Cities SCIENCE Society

When Holling meets Kandinsky: Panarchy, Resilience and Abstraction

“Identifying and managing risks is nowadays key in any strategic planning. Under the wording risk management, companies aim to control and minimize the risk level that could impact their short or long-term profitability. In cities, risk management is expected to drive urban planning safety approach and better integrate hazards occurrence. It is based on procedural and systemic approaches, most of the time certified, built on conventional and analytical methodologies.

In a rapidly changing world where surprise is likely (1), the same descriptive approach applies on our environment threatened by natural hazards. Our fragility awareness reflects in greater consideration for human vulnerability, but the modus operandi to decrease the risk level is comparable, based on decision tree analysis and quantitative/qualitative frameworks. Amongst the first questionings on the relevance of such linear thinking, Holling’s “panarchy” (2) conceptual model introduced the idea that social and ecological systems are interlinked and continuously restructure and renew depending on their environment. By reconsidering the norms, introducing unpredictability as a random variable and conceptualizing risk management, the seeds of resilience had been sowed. On one hand, a normative approach; on the other, a critical thinking?”

Full post and a rich bibliography here.


Categories
Art

GREETINGS 2018

Categories
Art Cities Misc Vizualization

Wonderful New Year 2014

Carte voeux 2014_CITADYNE

Categories
Art Books Cities Geography Graph analysis Networks Vizualization

Art and Geography

Three years ago, a friend of mine who is a genius artist (Catherine Bolle), asked me to do geography on her biography. She told me many things about her life, during some few sundays afternoon in the Beaurivage Hotel in front of the lake in Lausanne. It took one year to build the data and think about the pictures to produce. Then to build them and interpret with a nice text.

C_ROZENBLAT_BOLLE_PARCOURS

IMAGE_BOLLE

Categories
Art Economy Environment SCIENCE Simulation Society Vizualization World

Tomorrow’s world

A guide to the next 150 years

 by BBC news graphics

https://www.bbc.com/future/story/20130102-tomorrows-world

Categories
Art Books MAPS

Interactive maps of Jean-Jacques Rousseau’s letters

Everything is mappable.

The letters written by Jean-Jacques Rousseau are classified by place and time. So you can enter into the Space-time of the author.

https://www.rousseauonline.ch/maps/maps.php

Categories
Art Cities Environment Geography MAPS Misc Vizualization

Dissection of cities

I don’t know what we can learn from the physical dissection of cities: maybe some fractal analysis could work?

see the website

Berlin:

New York City:

and other cities in the website (made by Armelle Caron)

Categories
Art Books Vizualization

Garamond

For the celebration of the 450th anniversary of the death of Claude Garamond

https://www.garamond.culture.fr/en/english

Categories
Art Books History Society Vizualization

Virtual exhibition of typography

The French National Library organizes different virtual exhibitions which are very interested for who wants to learn more about history of books, print and typography. Recently, a new exhibition about the actual creation of new typographies.

https://www.imprimerienationale.fr/expo/