The Covid-19 pandemic has contributed to the daily use of graphics, dashboards and visualizations that helped make sense of its spread and global development. Data are increasingly available and easy to manipulate and diffuse. Big data inform business decisions and policy-making but they play an increasing role also in journalism, higher education and in public debates overall.
The European Journalism Center, supported by the Google News Initiative, have released their second Data Journalism Handbook , an open access e-book that inquires into the foundations, practices and actors of data journalism. The way data are incorporated in public debates is changing the way news are told to the public. Social scientists are also increasingly using big data in their researches, and for these to be relevant to society it is important to be able to disseminate results and communicate them properly. This is why this e-book might also be of interest for academics that wish to communicate and diffuse their research findings.
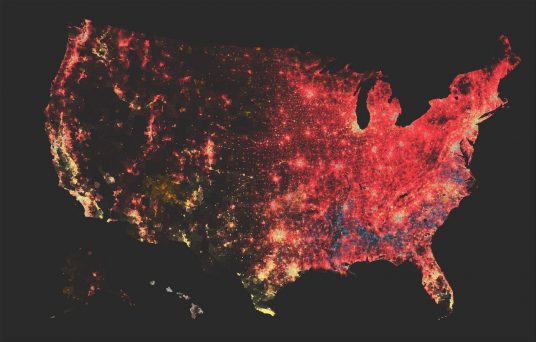
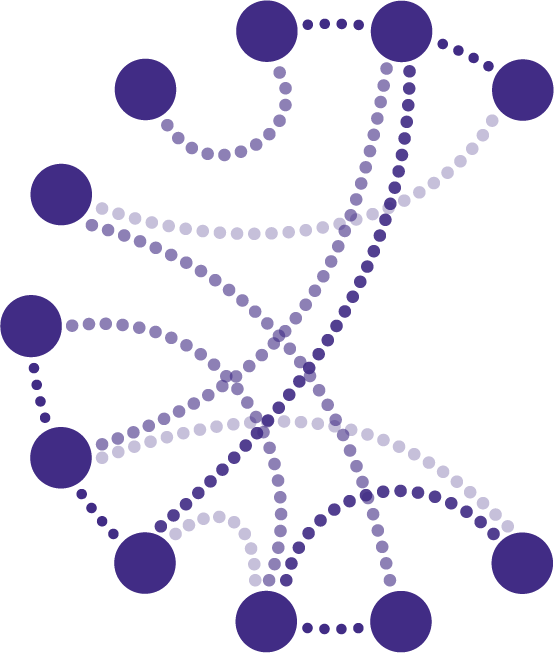
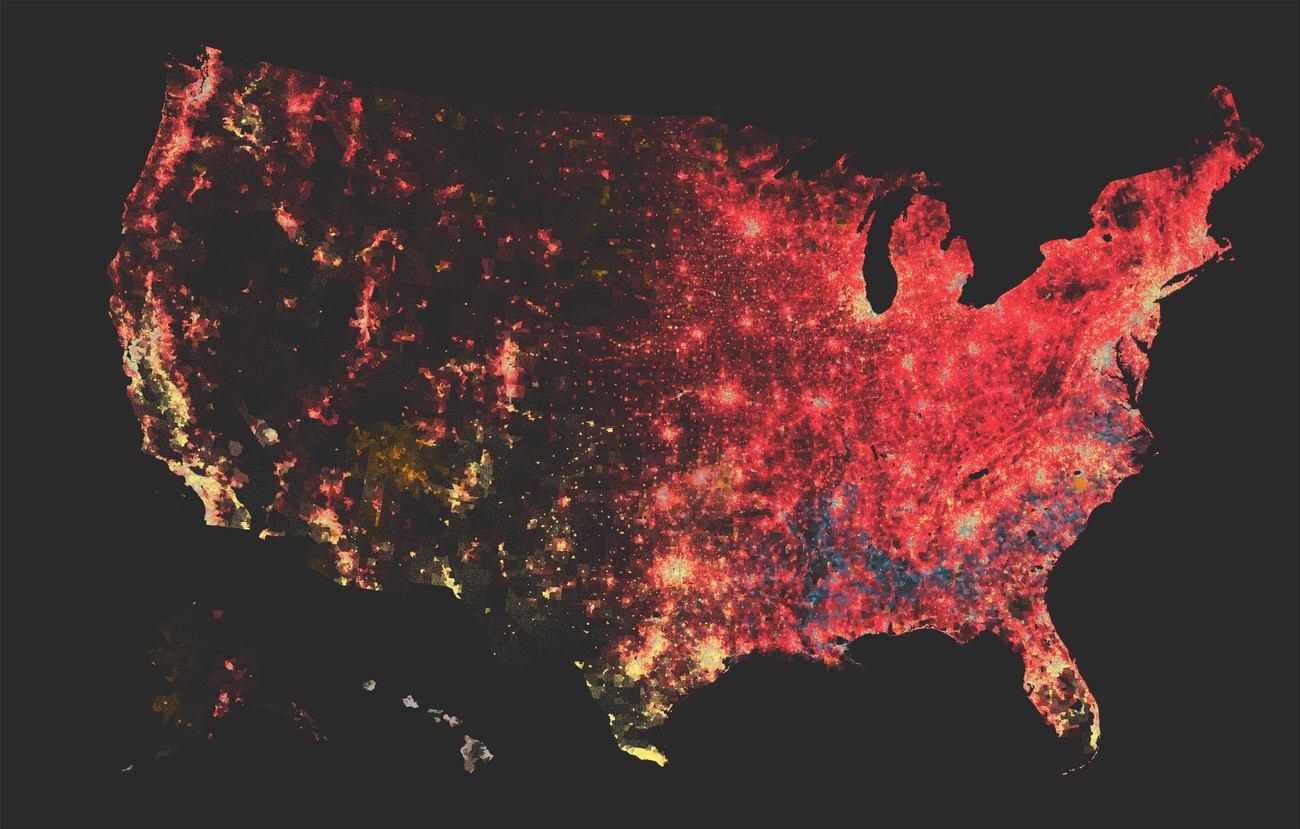
(Here below: an example from chapter 2 and an application to ethnic segregation in the USA)
Dot-density population map of race in the United States from census estimates, 2018. Source: The Washington Post. https://www.washingtonpost.com/graphics/2018/national/segregation-us-cities/


