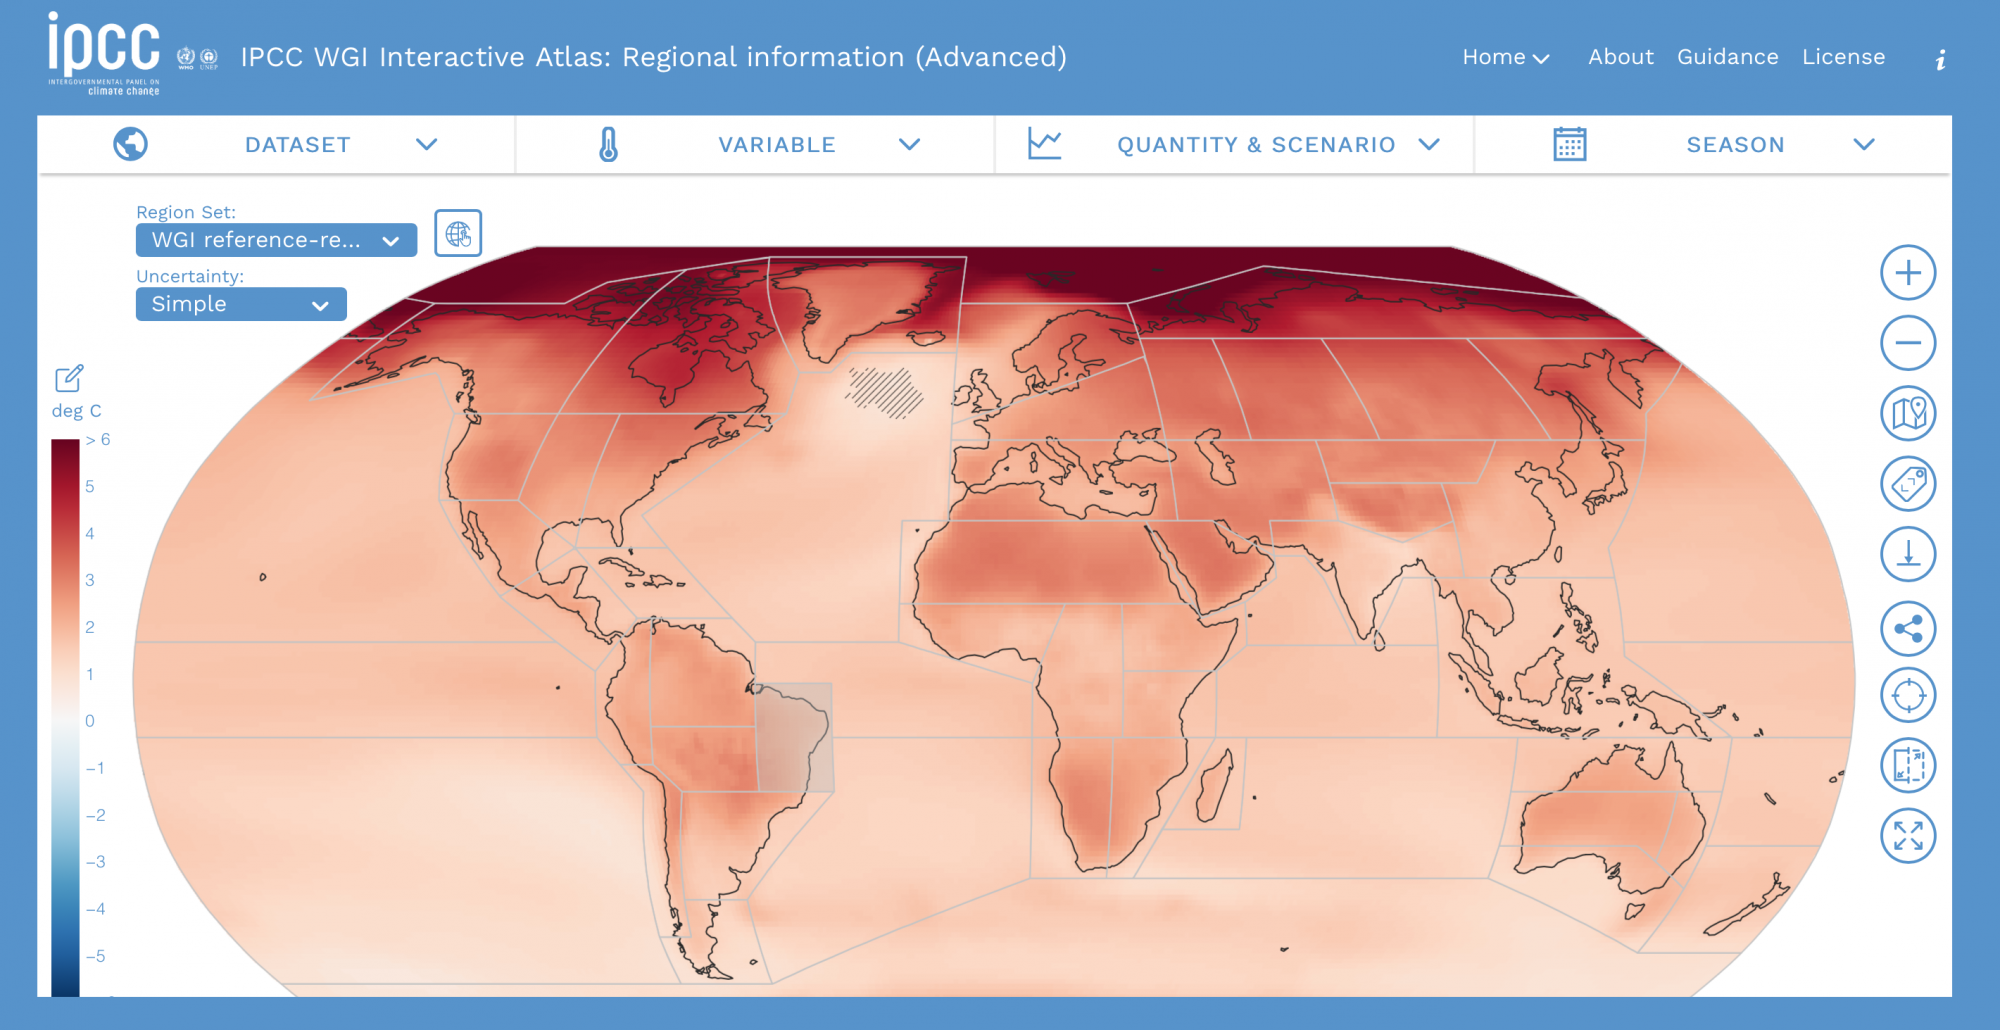
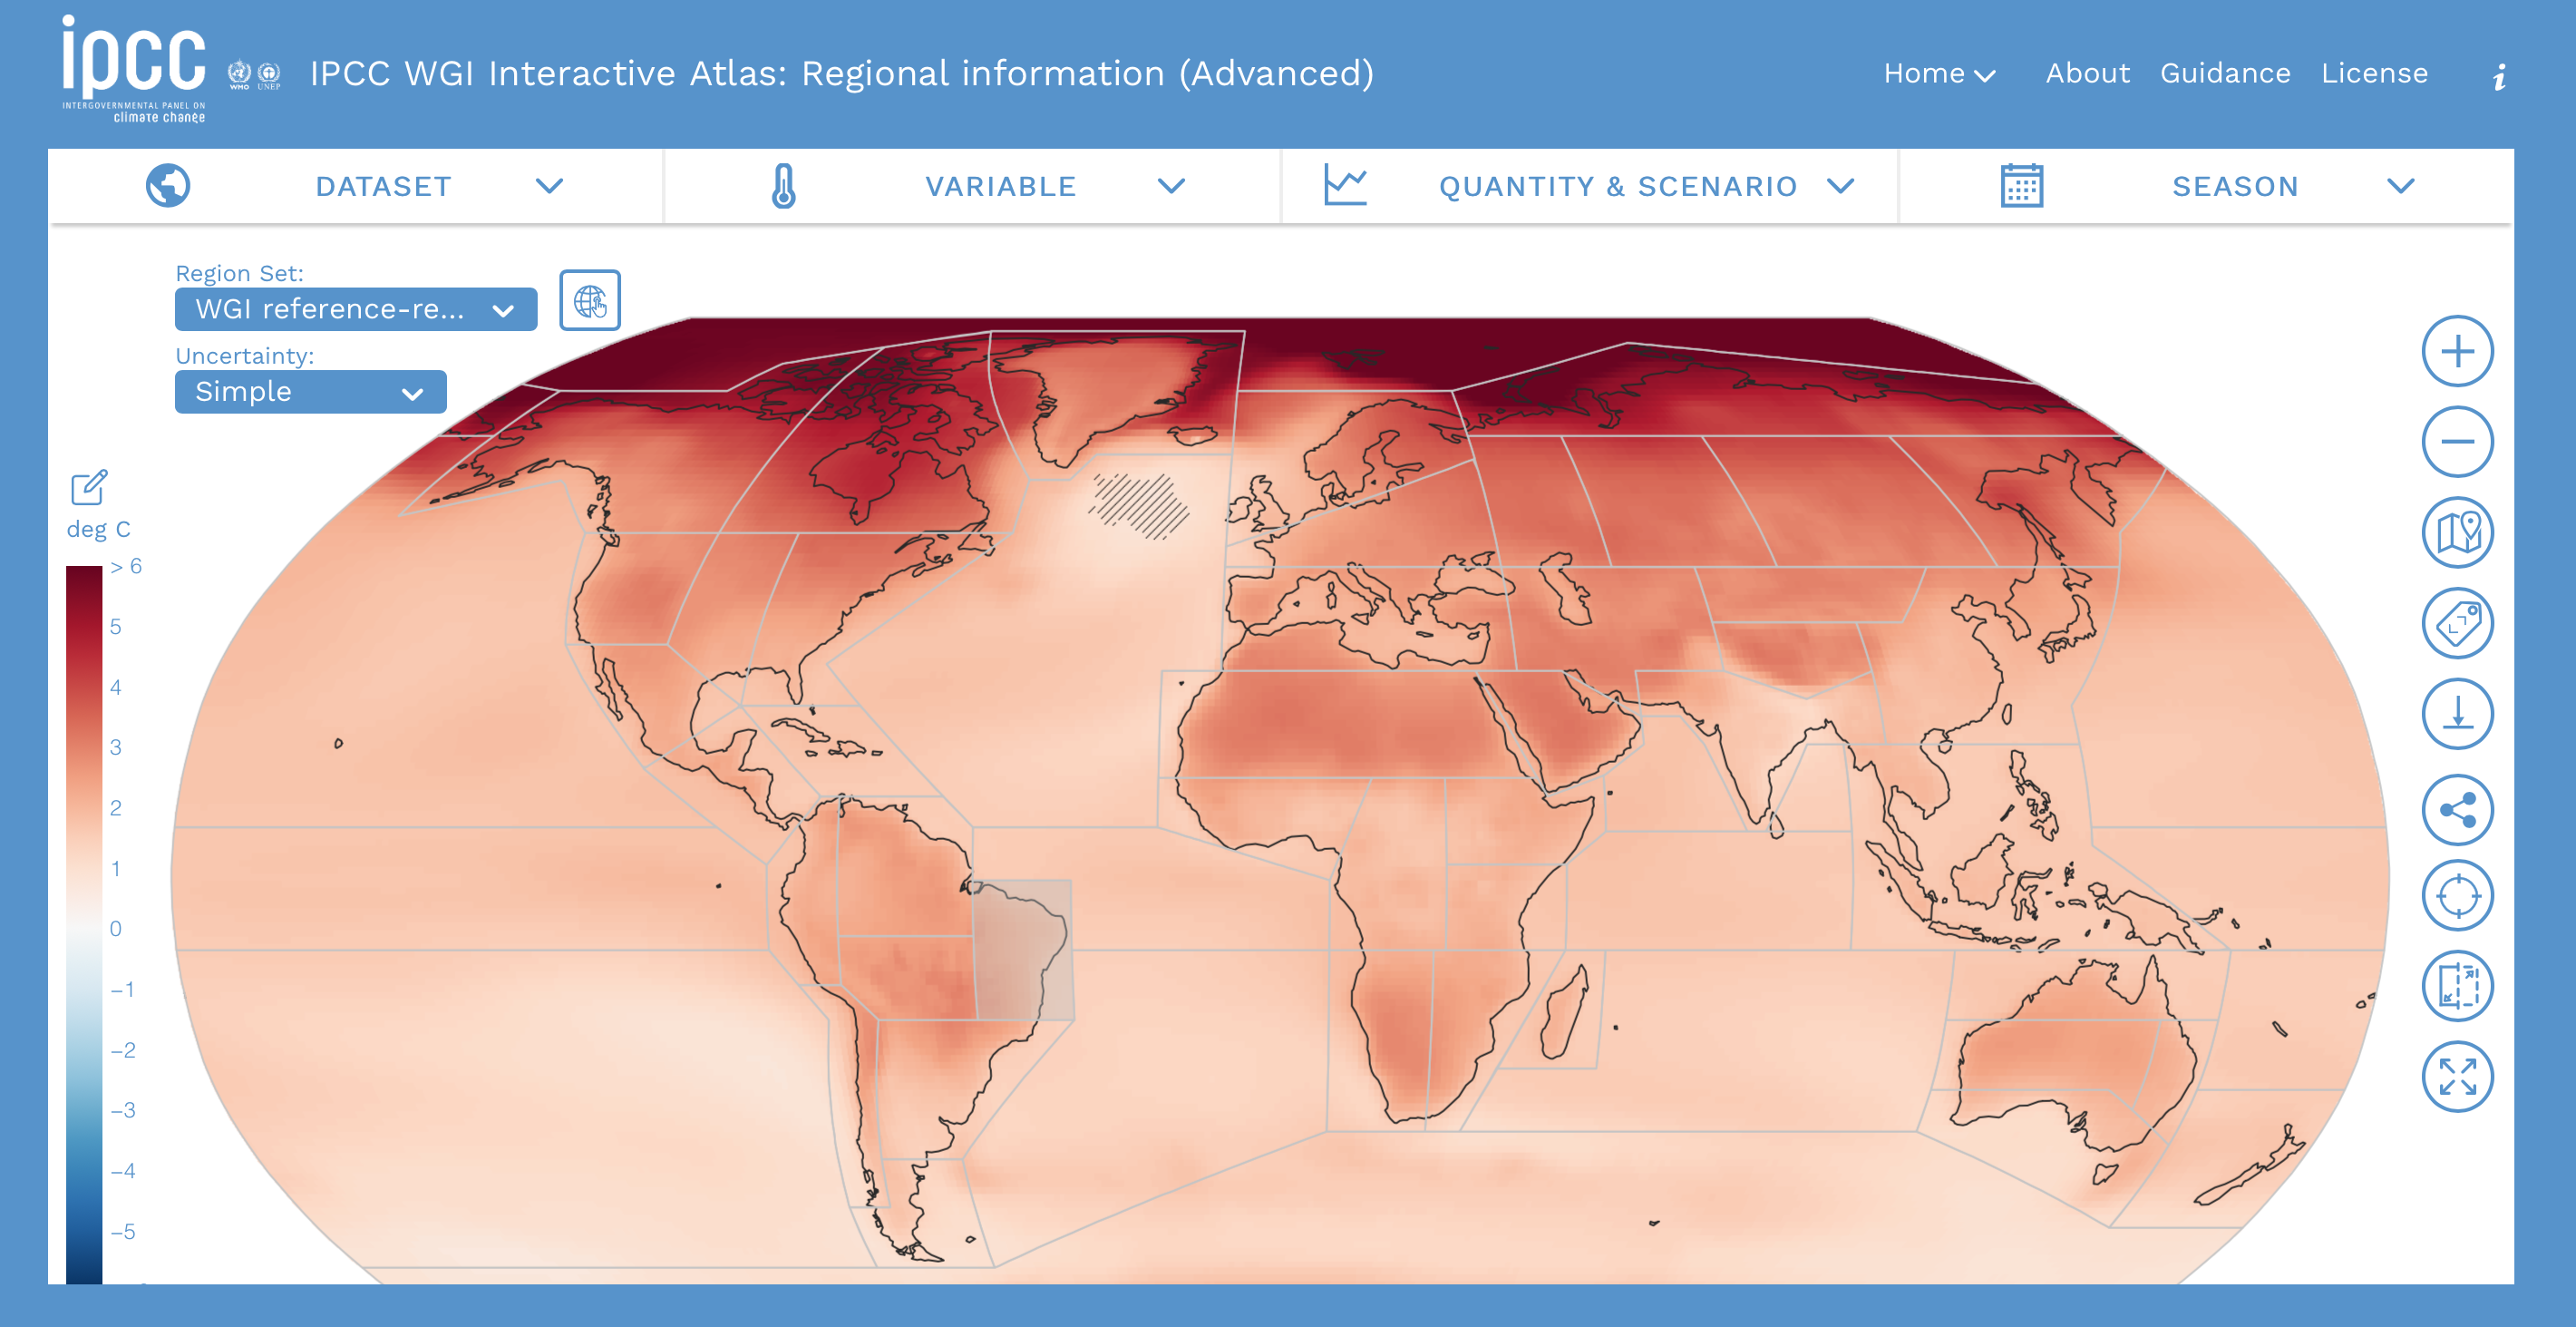
The IPCC has recently published their sixth assessment report on the physical evidence of climate change. The report has again confirmed evidence of climate change across all global regions, which will affect rainfall patterns, sea levels, exposure to extreme heat events. To better understand the impact of these changes across regions, the Working Group I has produced an interactive Atlas that allows to visualize the geographical impact of different climate change scenarios. Climate change is here, and it is crucial to comprehend its varying geographical impact, so this is a very welcome tool to help researchers and policy makers in this task.


