|
|

|
|
|
|
|
|
|
Facility News
Dear all,
This month, we're celebrating the 6th anniversary of our newsletter 🎉 ! This newsletter saw students arrive as young cytometry padawan and leaving as freshly graduated PhD expert in the ways of the flow ! It's been a pleasure to support you through all these years and we're planning on continuing for many years to come !
|
In this month FACS Tips, Kevin discuss about autofluorescence and how to address its unmixing based on your sample. Please give it a read !
|
|
Céline Vuillefroy de Silly won the mug of the month below, congratulations to you ! Please come by to our office at the SE-C Biopole to pick it up !
|
|
|
Please try to answer our quiz it and get a chance to win our next mug of the month ! Good luck to you all !
|
|
|
|
|
|
FACS Tips
|
Autofluorescence: How Much Is Too Much to Unmix?
|
|
Autofluorescence (AF) is a topic we've covered before, but it remains one of the most consequential factors in getting clean data from complex samples. When modeled correctly, AF unmixing can dramatically improve resolution and when handled poorly, it drives an unmixing mess that confounds your results.
|
|
|
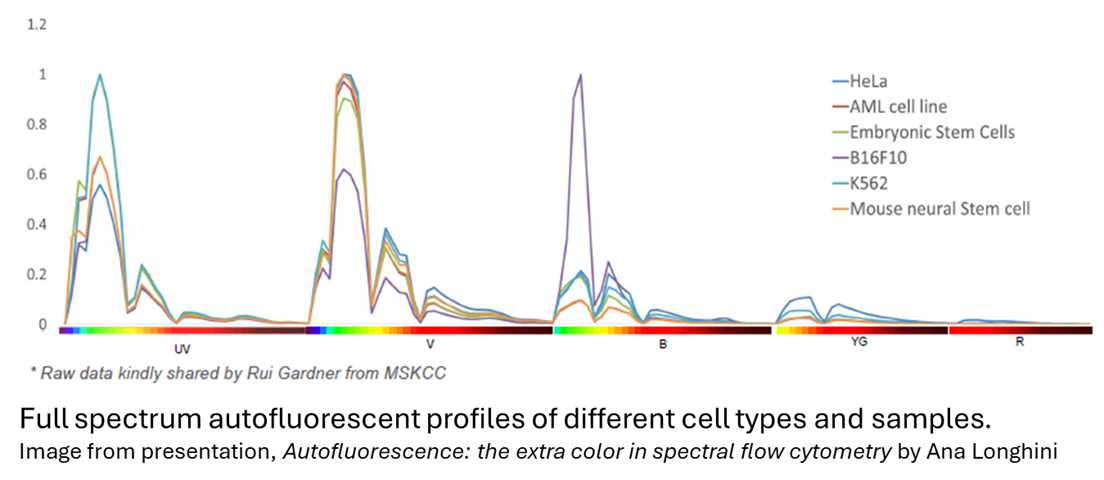
As a quick refresher: autofluorescence is the intrinsic fluorescence present in cells without any staining. It originates from endogenous molecules found in varying abundances across cell types, and it can shift depending on how samples are treated, including the buffers and fixation methods used. AF most commonly appears in lower-wavelength UV, violet, and blue channels, which makes fluorophores in those channels particularly susceptible to interference.
|
Unmixing vs. Subtraction
|
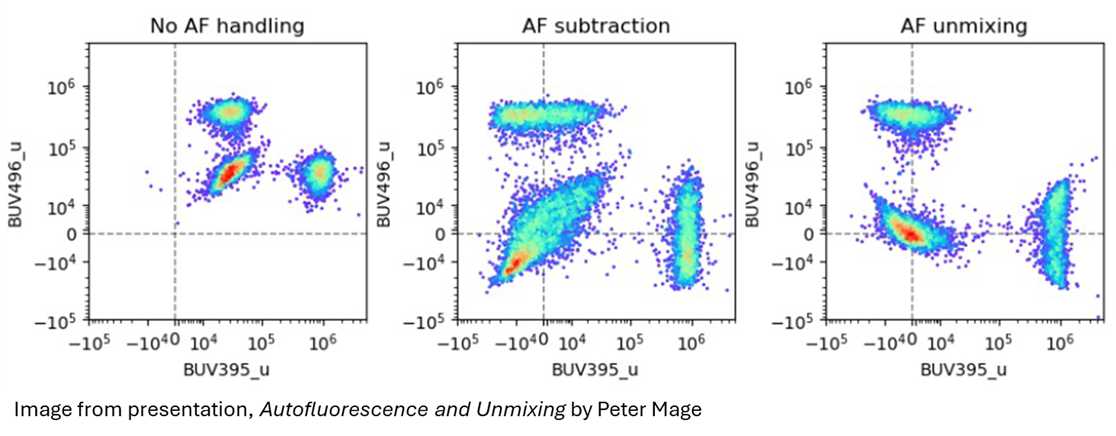
It's worth clarifying what AF unmixing actually does, because it's often confused with subtraction, a confusion we ourselves in the facility can also have a habit of saying. Subtraction simply removes an average AF value from the raw data. This centers the data around zero, but leaves substantial spread due to cell-to-cell variability. AF unmixing, by contrast, treats autofluorescence like a fluorophore and makes a per-cell adjustment. The result is tighter, more interpretable data.
|
|
|
This per-cell correction is one of the core advantages of spectral instruments like the Cytek Aurora, particularly for sample types notorious for complex AF, such as lung, tumor, and pancreatic tissue.
|
The challenge: finding the right fit
In SpectroFlo, the default approach is to use the unstained sample (gated on the population of interest) as the single AF reference for unmixing. For more heterogeneous samples, the Autofluorescence Explorer tool allows you to input multiple AF spectra. However, a key question remains: how do you know when you have the right number?
|
I recently attended an excellent presentation on this topic by Dr. Anna Longhini (Sony) and Dr. Paul Mage (BD), who walked through what happens under the hood during AF unmixing, common issues, and a practical framework for your own experiments.
|
|
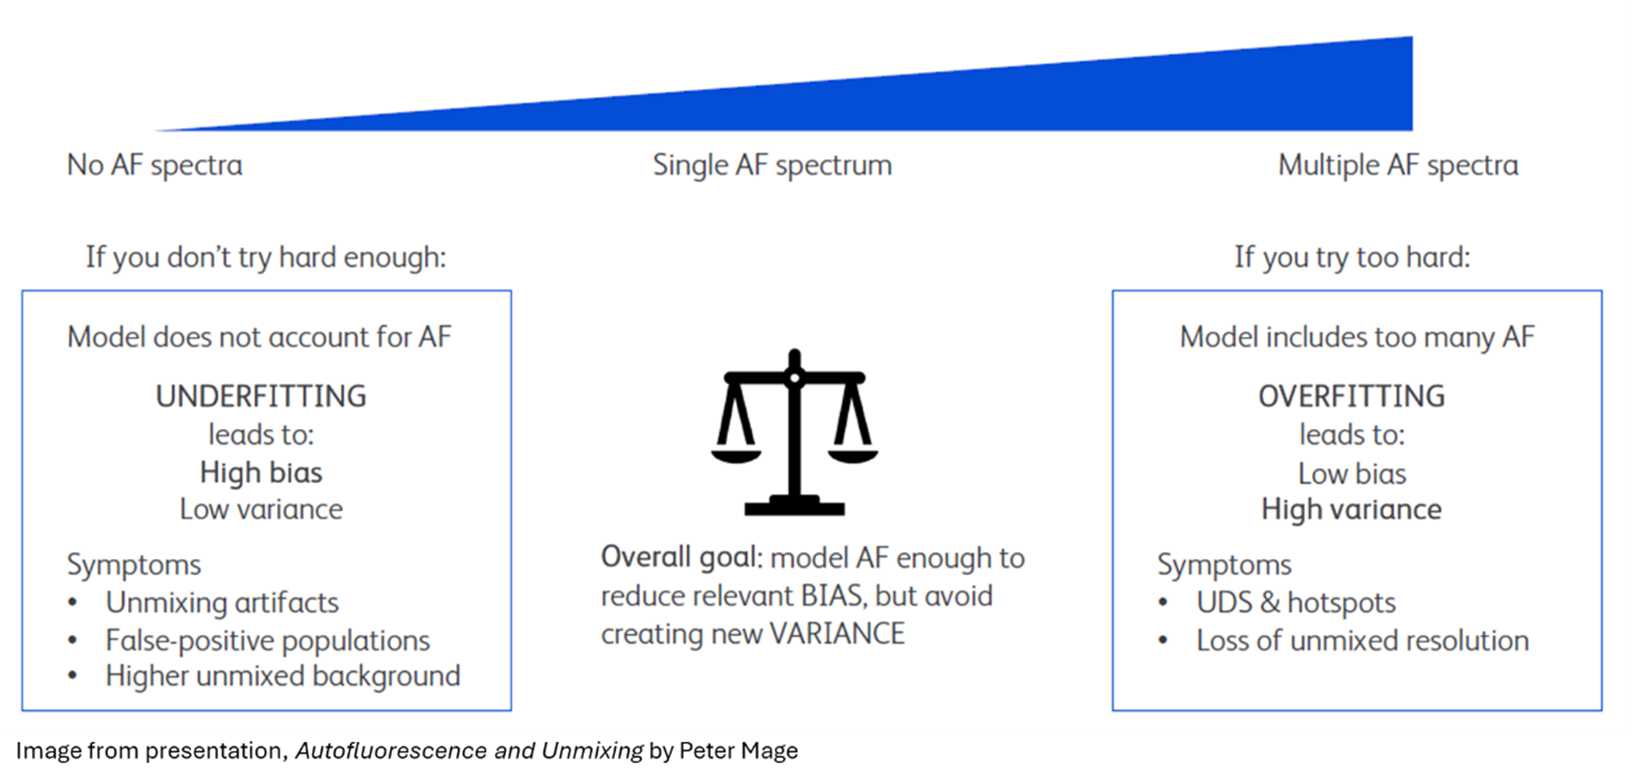
The core challenge is finding the balance between two extremes:
|
|
|
|
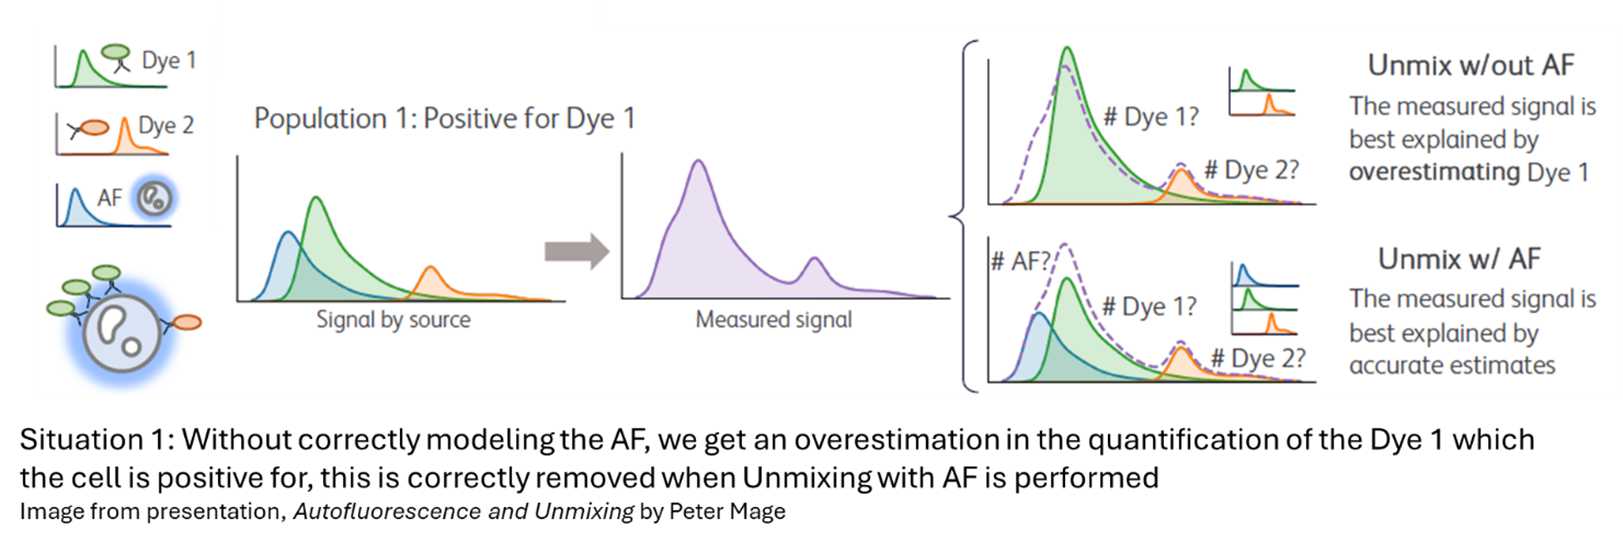
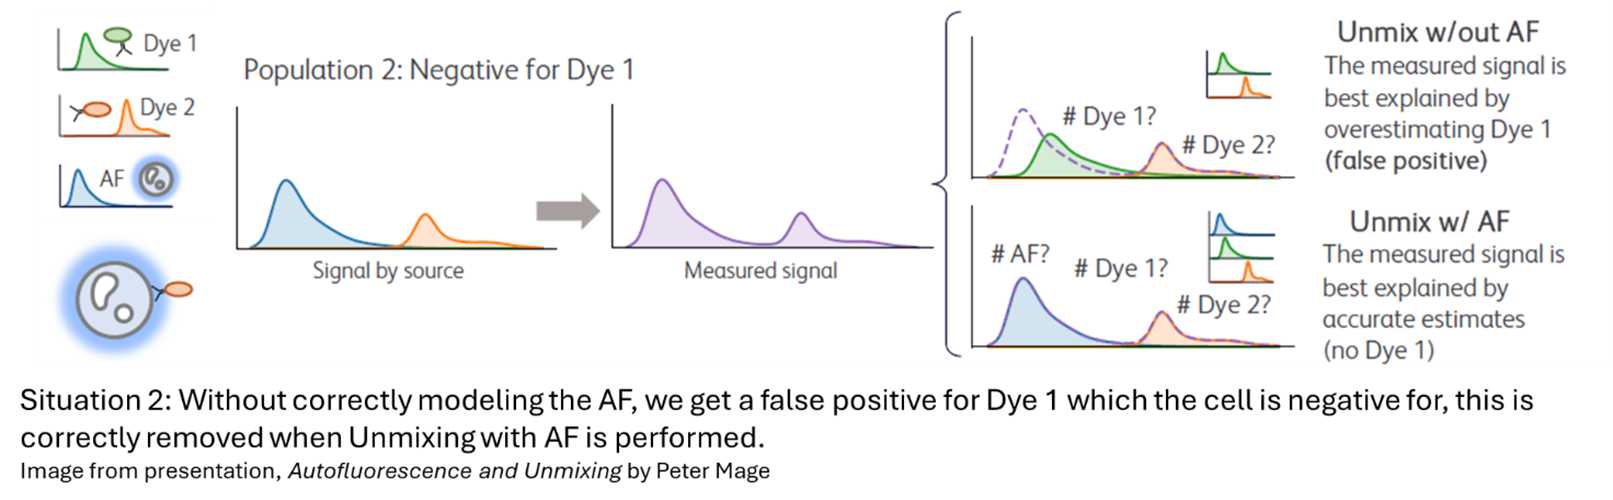
Underfitting (too few AF spectra): AF is not adequately corrected, introducing systematic bias into the data. This can be seen in the two situations below.
|
|
|
|
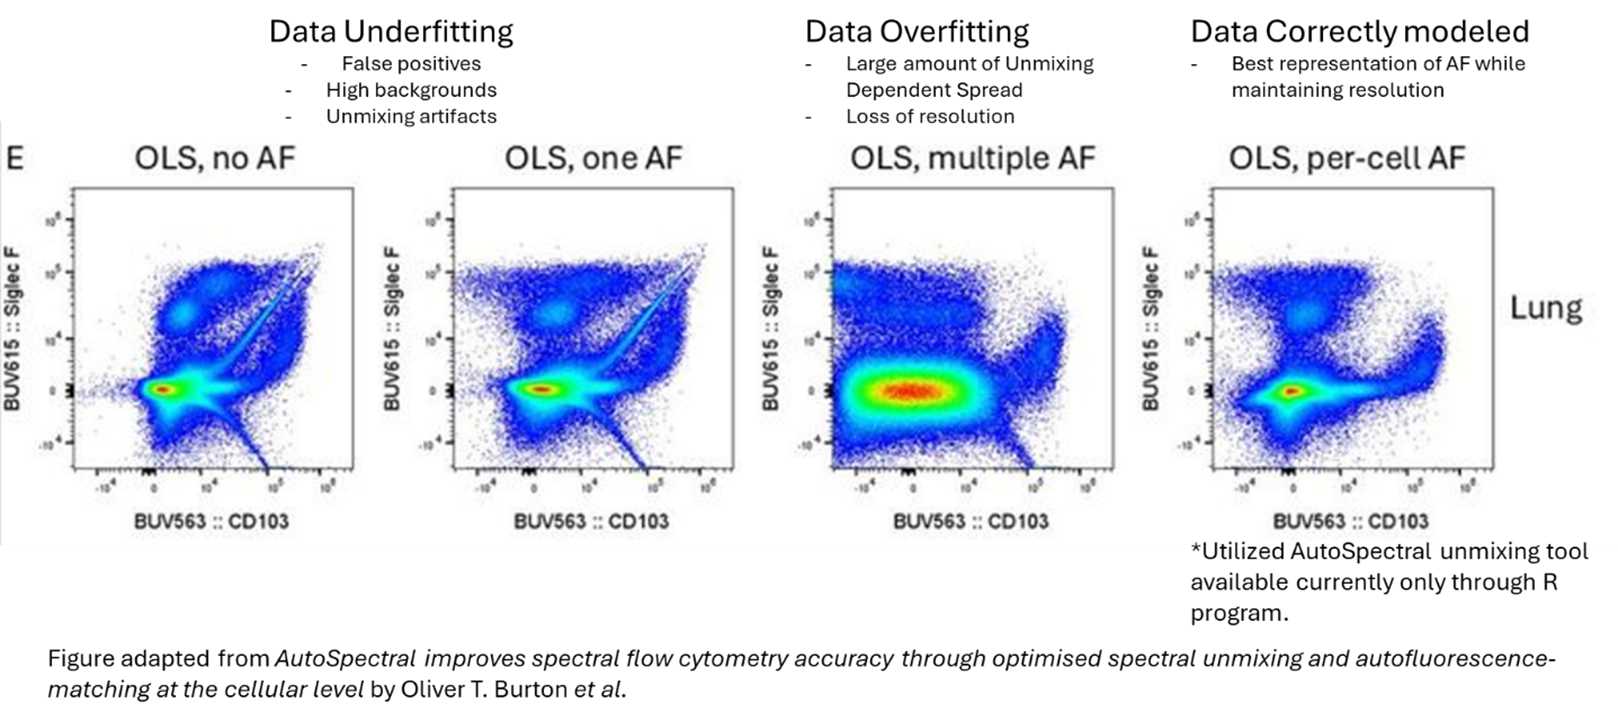
Overfitting (too many AF spectra): Excess variance is introduced, leading to increased spread and reduced signal resolution, symptoms that can be visible in your NxN plots.
|
|
|
Additionally, but somewhat unrelated, identifying and unmixing multiple AF spectra is a laborious process and is difficult to replicate consistently between researchers, even when working with identical controls. Algorithms like AutoSpectral aim to address this in the future, but for now, careful manual judgment is required.
|
A practical framework
Here's the approach recommended by the experts:
|
Start with a single AF spectrum. Assess the unmixing result using your gating strategy and NxN plots. Look for artifacts, broad negatives spreading across multiple channels, or unusual spread.
|
Start first by looking at your unstained sample. Focus on how negative populations look, then move to a fully stained sample and assess resolution.
|
Explore for additional AF spectra. Can you identify more than one distinct spectrum in the unstained sample? With experience, you should begin to anticipate when heterogeneous AF is likely given your sample type. Gate a second or third AF population, apply it, and re-evaluate: Did artifacts decrease? Are negatives smoother? Is resolution better?
If things look worse, pull back. Strange new patterns in the negatives are a sign of overfitting. Return to a single AF unmixing.
|
With experience, recognizing the signs of under- and over-correction becomes more intuitive. But AF modeling remains one of the more nuanced aspects of spectral flow cytometry, and it's easy to introduce errors without realizing it. This is certainly still an expanding field and hopefully we will have better guided tools and instructions soon.
|
It is important to say that even well unmixed AF can’t make up for poor panel design. So, if know you will have a complex sample with heavy AF around say BV421, best to avoid putting that fluorophore in your panel.
|
|
If you suspect your AF correction isn't quite right, or if unmixing artifacts are affecting your data quality, don't hesitate to reach out to FCF staff. It's exactly the kind of problem that benefits from a second set of eyes.
|
|
|
|
|