Interestingly…. they prefere parks and river sides :-(((( What a new information!!!!


Interestingly…. they prefere parks and river sides :-(((( What a new information!!!!


By Jaume Serra published in the “Courrier international” of January 2nd 2014

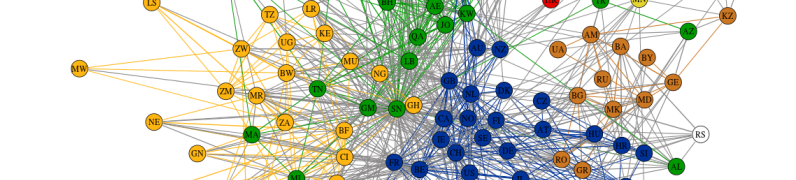
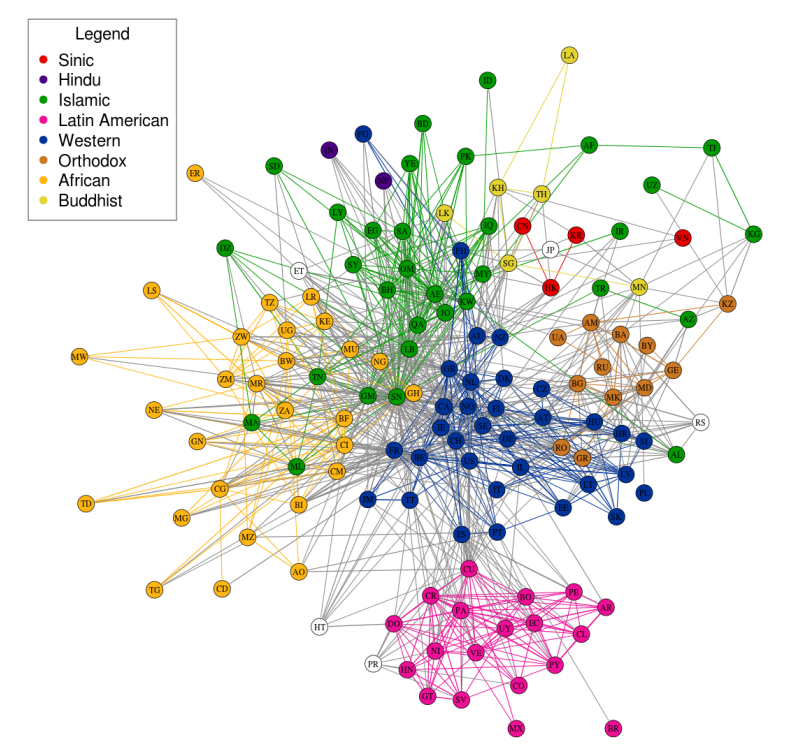
The Internet was supposed to let us bridge continents and cultures like never before. But after analyzing more than 10 million e-mails from Yahoo! mail, a team of computer researchers noticed an interesting phenomenon: E-mails tend to flow much more frequently between countries with certain economic and cultural similarities.
see the paper in Washington Post
original paper: State et al. 2013 World internet

The system calculates the distance from a city to another one, according to faster path, or lower cost.
Go to “Mapping ORBIS”, It draws the path and create many different maps and graphs (in “Map gallery”). It’s a pity that the Emperors did not have this system 🙂


A website showing the proximities between sciences, between fields, maps of ontologies:
https://www.science-metrix.com/OntologyExplorer/#app=cde1&8f8c-selectedIndex=2

https://www.science-metrix.com/OntologyExplorer/#app=cde1&8f8c-selectedIndex=1

Three years ago, a friend of mine who is a genius artist (Catherine Bolle), asked me to do geography on her biography. She told me many things about her life, during some few sundays afternoon in the Beaurivage Hotel in front of the lake in Lausanne. It took one year to build the data and think about the pictures to produce. Then to build them and interpret with a nice text.


The magazine Science underline the huge advance made in network analysis. Networks interact, create cascading effects……
