|
|

|
|
|
|
|
Facility News
November comes and maybe the Fall with it🍂? Given the summer vibes we had in October, who knows ! This month is well known in the USA as Thanksgiving Month 🦃, a perfect mix of humongous amount of food and infinite naps in between. If you ask me, that's basically Paradise ! An integral part of Thanskgiving is also taking the time to be grateful for what you have in your life 🙏 ! I know that I am grateful to work with you guys ! Thanks for being kind when the analyser clogs and patient when the sorter misbehave, it is deeply appreciated ❤️
|
|
As a treat, here's our most recent group picture from our hike at La Dôle ! Indeed, we have to be in shape to help you all !
|
|

|
In this month FACS Tips, we are starting a series about dimension reduction e.g. tSNE and how it can help you understand but also present your data in a more pedagogic way. Check it out and let us know if you have any questions !
|
|
Last month Quiz was won by Margaux Saillard ! She won a Toblerone bar and the the exclusive mug of the month, relating a struggle most user face one day :
|
|

|
|
Each month, we will give away one of those special and unique mug designed by the FCF team so please take few minutes to answer the quiz HERE.
|
|
|
|
|
|
FACS Tips
|
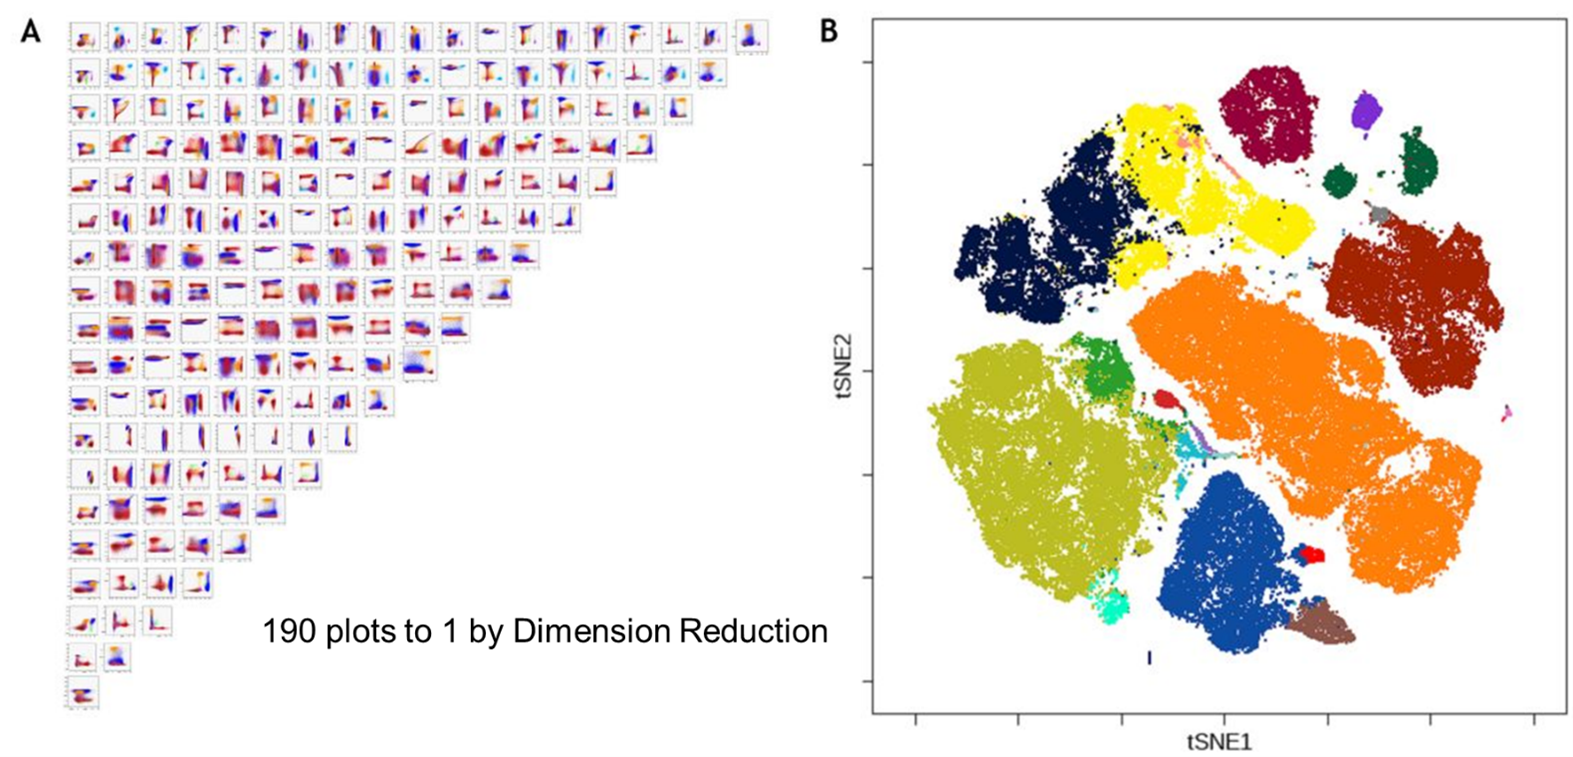
Dimension Reduction: Making Less Mean More: 10 plots to 1
|
|
When it comes to data analysis, our approach almost always stays the same. We gate through our events, plot by plot, until we have our desired population. In the end we have a hierarchical gating workflow that progresses us to our plot of interest, and along the way we hope our audience doesn’t get lost or lose sight of what matters. If we have a 10 marker panel, it’s manageable to work through the 5 or so plots, but if we increase it to 20 markers, then suddenly that’s twice as many plots at least, and the complexity rises. With panels of well over 40 colours now feasible, simply projecting a gating scheme becomes more and more challenging as the number of plots required to get to our answer go up. It’s hard for us to visualize our data when the parameters, and therefore plots, increase at such a scale, and while we can focus on individual plots we can lose sight of some of the big picture details of our data. Dimension reduction seeks to overcome these issues, and helps us to achieve the goal of more easily visualizing data in an intelligible way.
|
|
|
Image from Beckman Coulter LINK
|
|
|
Dimension reduction is a straightforward name for a somewhat vague process, but we can start to pick it apart. Every fluorescent channel in your panel represents a dimension, so if we have 20 markers, we have 20 dimensions. For our recorded data, this means we have likely 100,000s of events with near unlimited combinations of expression patterns for each of the 20 markers available, along with FSC and SSC. This is what lends the name High Dimensional data, because to visualize it all, we would need to use many bivariate 2D plots. The goal of dimension reduction is to take all those events and reduce their complexity down to one artificial 2D map, where each event on this plot reflects all the parameters information. To do this, an algorithm will process your data and create two artificial parameters, an x and y, to redistribute the events. Each event's location on the map is decided by its relationship to other events with similar parameter expression. By clustering similar markers of interest, we should get a highly similar representation of our phenotypic hierarchical gating strategy as unique clusters on the map. Through this process, ideally our data becomes easier to visualize with the ability to see changes both globally in larger cell populations, but also in smaller sub-groups simultaneously.
|
|
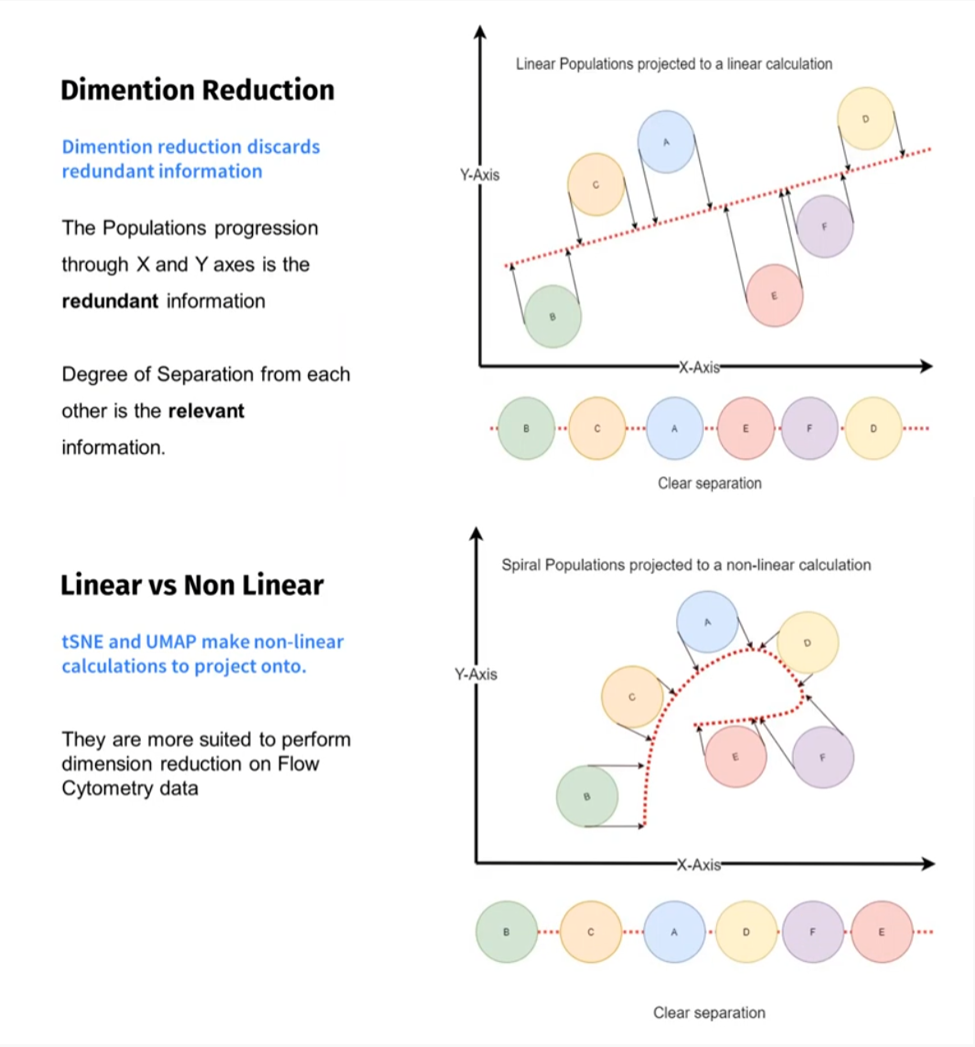
There are many methods for data reduction and some have been around for a long time. Principal components analysis (PCA) for example has been used since the early 1900s, and has a history of being used on flow cytometry data. PCA relies on a linear algorithm to reduce and arrange your data according to similarities. While PCA can still be a valuable tool and has advantages, such as speed of processing, it is no longer the popular approach, rather giving way to newer non-linear algorithms for data visualization that better serve to reduce your data. Two popular algorithms for flow cytometry data are t-SNE and UMAP.
|
|
|
From the Tercen webinar Explore High Dimensional Flow Cytometry - Part 3: Dimension Reduction LINK
|
tSNE stands for t-Stochastic Neighbor Embedding, and now comes included in the FlowJo 10 software. While UMAP, which is uniform manifold approximation and projection, can be added as a plugin. Both are non-linear dimensionality reduction algorithms, and both will create the desired 2D maps. They both have pros and cons, I’ll go into more depth on tSNE in a future newsletter.
|
Dimension reduction does not overcome poor experiment planning. All the important work that goes into panel design to ensure that you properly identify your cells of interest and remove undesirable cells is still necessary. While dimensional reduction techniques are machine learning algorithms, it does not mean you can just avoid preparing a hand gated analysis plan as you normally would. Messy data, including dead cells, air bubbles, debris, etc, can influence the ability of the algorithm to accurately cluster data, so preprocessing and cleaning is still incredibly important before performing a dimension reduction algorithm. Dimension reduction makes for great visualization of changes between samples for populations of interest, but for strong quantitative data, it is likely you will still need to perform the careful hand gated analysis as done previously. An advantage of dimension reduction techniques is that they can be used sequentially, meaning you can use a UMAP to identify global clusters and then a tSNE to pull out more subpopulations, this can cut down on the processing time required.
|
|
Dimension reduction methods allow us an opportunity to make our high dimensional data more visual and therefore easier to understand. By removing the clutter of a 10+ plot scheme down to one colourful map, we can better focus on the changes we want to demonstrate. And as these tools become better integrated into FlowJo and other analysis software, there’s no reason not to try them and see how they work with your data. However, they don’t provide a shortcut to success, and will still require time and energy to make sure they are used properly. If you have any questions feel free to ask any members of the staff and look forward to future newsletters on more in-depth overviews of dimension reduction techniques.
|
|
|
|
|