|
|

|
|
|
|
|
Facility News
Hi everyone,
March is upon us and as you may have noticed, we did a small spring cleaning and organisation 🧹 in the main flow room at the Biopole ! We are ready for the new season 🌱 !
|
In this month FACS Tips, we will talk about Spreading Errors and how it affects your data. As you will see, there is nothing a good panel preparation can't deal with and I hope it will encourage you to do more research and optimization before staining your precious samples !
|
It has been almost a year since we've introduced the newsletter and we would like to thank you for your continuous support and positive comments. In a way to develop fun interaction but also encourage learning, we've decided to setup a monthly Newsletter Quiz !
The principle is simple : each month, we will ask you 3 questions related to the FACS Tips Section and a 4th guess question to help deciding the winner ! (The questions can be found at the end of the newsletter).
|
|
What would be the price to win you may ask ? Apart from an infinite amount of respect, love and gratitude from yours truly, we will also give the winner a tasty Toblerone chocolate bar customized by us ! (See deliciousness below).
|
|

|
We will set up a box in each location for you to drop you answer ! You can either print the note or come by the box to get a printed one. In the Biopole, the box will be next to the sorter lab and at the Agora, it will be located in the main flow room !
|
|
|
|
FACS Tips
Spillover-Spreading
We often blame compensation for causing problems, misshaping our data, and adding to our list of headaches when it comes to experiments. And while it certainly doesn’t make things easier for us, compensation can also reveal problems we didn’t know were there. This is the case for spillover-spreading errors. While we briefly overviewed this topic in our newsletter on panel design (link), it is a likely source of error that deserves more attention as it can have a greater influence on the quality and usability of our data than the compensation matrix. It is very likely we have all run into examples of spreading in our experiments. A single positive population that has the appearance of a trumpet or a tree as it moves higher and higher in intensity. This is spreading.
|
|
|
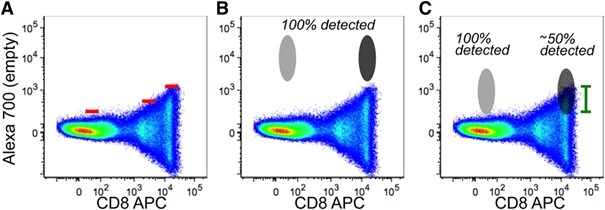
In this figure we can see a large spread form the CD8 APC single positive population into the Alexa Fluor 700 detector, this spread increases with higher intensity signal (A). While a bright well separated population can sit above the spreading and be easily identifiable (B), a weak poorly separated population can be hidden within the spread of the APC single positive spread (C).
Image from Cossarizza, Andrea et al. “Guidelines for the use of flow cytometry and cell sorting in immunological studies (second edition).” European journal of immunology vol. 49,10 (2019): 1457-1973. doi:10.1002/eji.201970107
|
|
|
Relation to Compensation
|
It is a mistake to think that just by avoiding high compensation values we can achieve nice plots. Compensation values and spreading are actually independent, and while adjusting voltages can alter the compensation values produced, it will not change the spreading error. Compensation is only the subtraction of spillover signal. Therefore, we can’t rely on compensation values to predict spread, as it’s possible that lower compensation values will be observed in higher spreading fluorophore combinations. Rather, to reduce the impact of spreading error in our experiments we need to focus on careful panel design.
|
|
|
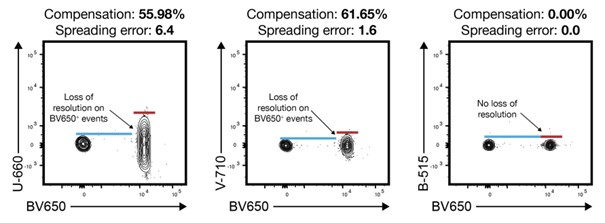
Image from University of Washington Flow Cytometry
|
What is Spillover-Spreading
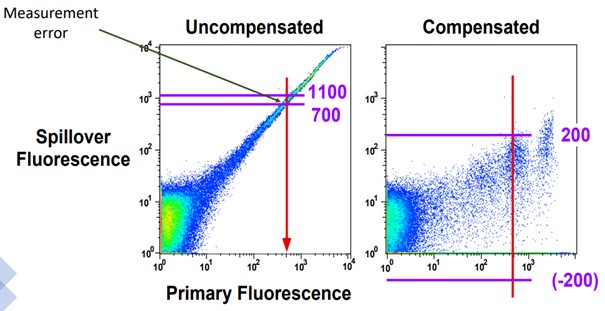
Spillover-spreading is largely a product of what’s called the “Poisson Error”, and it’s related to photon detection. Photons can be hard to properly count, which creates error in the measurement from the detector. When you have unwanted spillover in a detector, it reduces the sensitivity creating error in determining the lowest signal that can be detected over the accumulation of signals from all other sources. Before compensation, the data resided on a more compact portion of the plot due to logarithmic scaling, but after compensation this population is shifted to a lower region of the plot where scaling is much smaller and measurement error becomes more visible. This produces the spread, and there are 3 basic rules for spreading;
|
- More spreading error occurs with more fluorophores in the detector, spreading is additive
- More spreading error occurs the more a fluorophore spills into another detector
- More spreading error occurs with brighter intensity
|
|
Image from University of Washington Flow Cytometry
|
It’s important to not get too lost in what spillover-spreading is as it can quickly get very technical, rather the point to get across is that it is an unavoidable part of how the machine measures signal and its result is that dim populations can be hidden within the spreading error as seen in 1st figure. This can be minimized by proper panel design.
|
Spillover-Spreading Matrix (SSM)
|
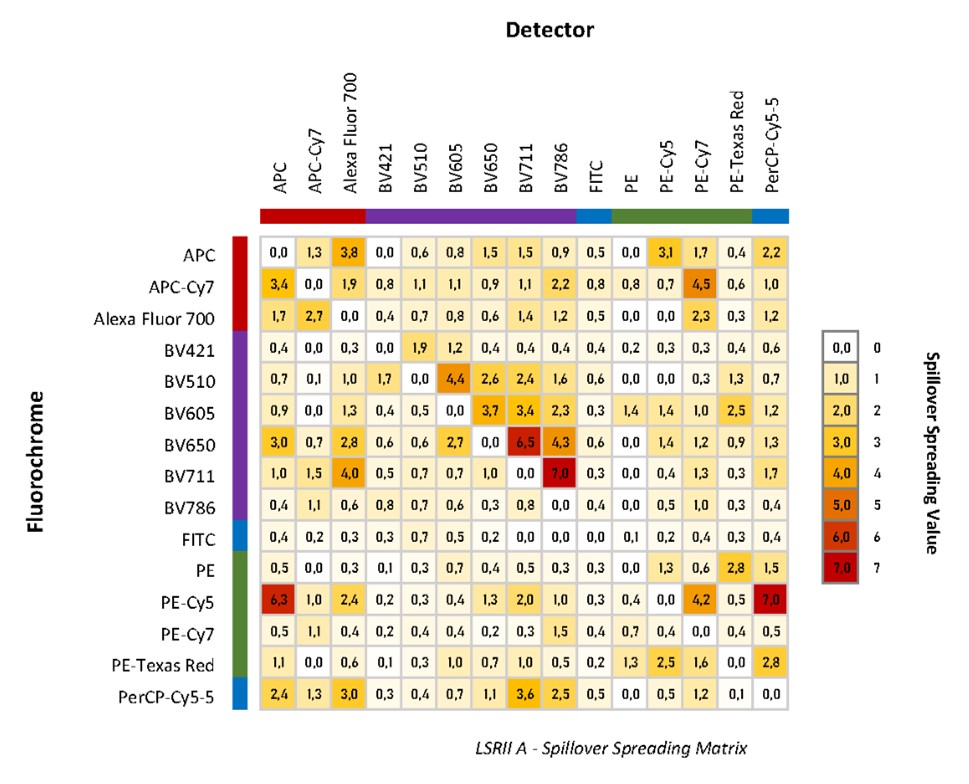
Spillover-spreading can be measured and visualized on machines though, and with a tool in FlowJo we can create a Spillover-Spreading Matrix (SSM). Because each cytometer can have differences in configuration, laser power and PMT performance, each machine will have its own spreading properties, so while the SSM will be comparable between similarly configured machines it is important to adjust on a machine by machine basis. We have created SSM for all the machines in the facility by running single stain CD4 samples for every channel. Since the SSM are normalized for marker expression this SSM will be applicable across all panels on that machine, so feel free to use our SSM as a reference.
|
|
Understanding a SSM is quite simple, rows represent the fluorophores donating spread, and columns represent the detectors receiving spread. For example, a fluorophore like PE-Cy5 donates a lot of spread, while BV768 detector channel accepts a lot of spread. The spreads are given a value with higher number representing more spread.
|
|
|
|
FlowJo has also added a feature called Total Spread Matrix, it is the same as the SSM, but it does not normalize to the fluorescent intensity of a marker. This allows researchers for better control of their dye brightness in panel design considerations.
|
Below are some tips on how to design your panel based on this information;
|
- Place dim expression markers on detectors that have very low vulnerability to spreading, for example PE in the figure above
- Bright on/off expression markers can be used on detectors that have much higher spreading vulnerability as they should still give discrete positive populations above spread
- When using fluorophores that heavily donate spread, don’t combine them with widely expressed markers, but rather on dump channels or low/rarely expressed markers. Assign them to a marker that is on a cell subset that does not co-express any other markers in the panel
- Try to avoid spreading error values over 3 to 4 when assigning fluorophores to dim populations
Conclusion
|
Spillover-spreading is an unavoidable part of how the cytometer measures signal, but we don’t have to let it drag down our experiments. By carefully designing our panels with spreading in mind we can make sure all our dim populations are resolved and our most important plots for presentation aren’t plagued by irregular spreading populations. As always feel free to contact the FCF staff if you have any questions or you need help with panel design.
|
|
|
|
Can you answer this ?
|

|
|
|
|